. 2011 Oct 3;8(5):1742-9.
doi: 10.1021/mp200101b. Epub 2011 Aug 12.

Molecular imaging of intracellular drug-membrane aggregate formation

Affiliations

Molecular imaging of intracellular drug-membrane aggregate formation

Jason Baik et al. Mol Pharm. .

Abstract

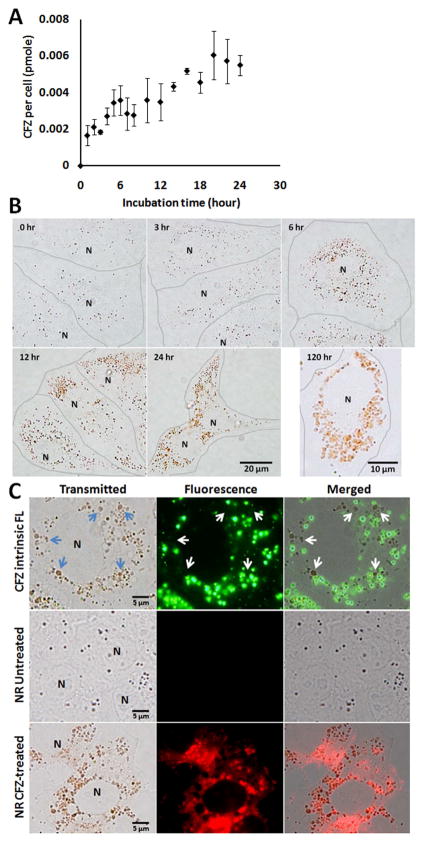
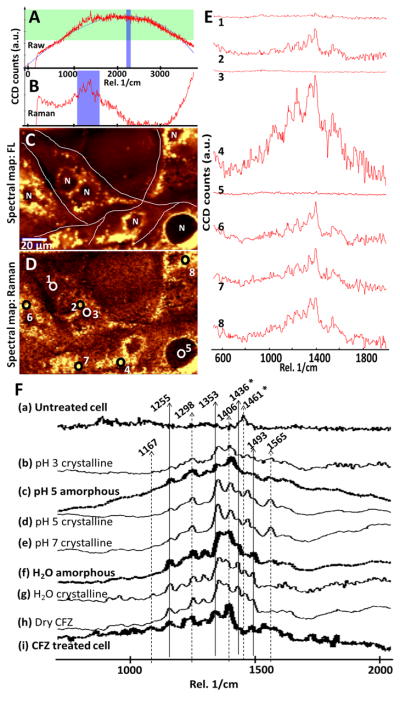
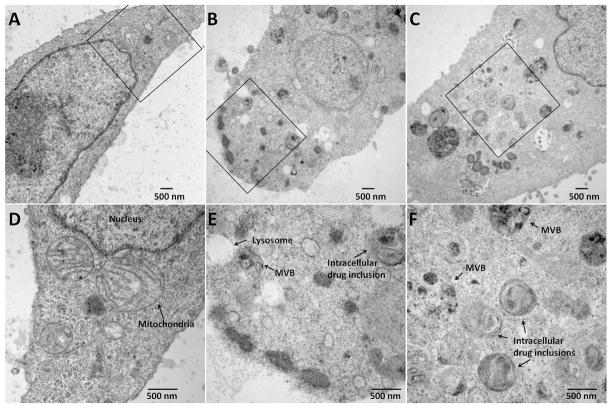
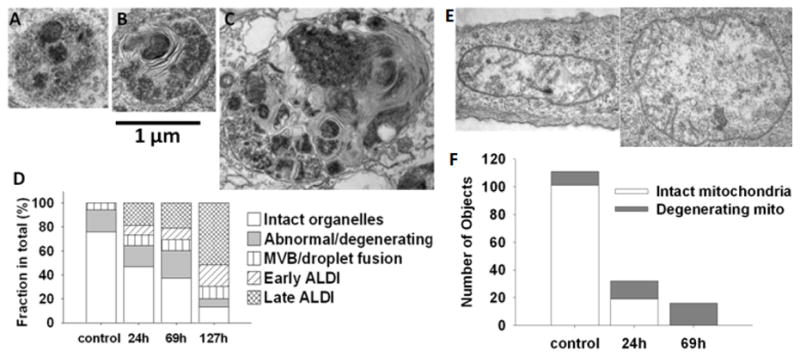
Clofazimine is a lipophilic antibiotic with an extremely long pharmacokinetic half-life associated with the appearance of crystal-like drug inclusions, in vivo. Here, we studied how clofazimine accumulates inside cells in the presence of supersaturating, extracellular concentrations of the drug (in the range of physiological drug concentrations). Based on a combination of molecular imaging, biochemical analysis and electron microscopy techniques, clofazimine mass increased inside cells in vitro, over a period of several days, with discrete clofazimine inclusions forming in the cytoplasm. These inclusions grew in size, number and density, as long as the drug-containing medium was replenished. With Raman confocal microscopy, clofazimine's spectral signature in these inclusions resembled that of amorphous clofazimine precipitates and was unlike that of clofazimine crystals. Additional experiments revealed that clofazimine first accumulated in mitochondria, with ensuing changes in mitochondrial structure and function. In turn, the degenerating organelles coalesced, fused with each other and condensed to form prominent drug-membrane aggregates (dubbed autophagosome-like drug inclusions or "aldis"). Like clofazimine, it is possible that intracellular drug-membrane aggregate formation is a common phenomenon underlying the reported phenotypic effects of many other small molecule drugs.


Figures

Figure 1
Figure 1
Clofazimine accumulation kinetics. A) Time course analysis of intracellular clofazimine accumulation. (error bars represent the s.e.m., N=3). B) Red intracellular drug inclusions grow in size. Brightfield images were acquired during 0 to 120 hour incubation in 10 μM clofazimine containing 5% FBS-DMEM. Lines were manually drawn to indicate individual cell boundaries. N: nucleus. C) Intrinsic fluorescence of CFZ and Nile Red (NR) staining of control and drug-treated cells. Cells were incubated with CFZ containing DMEM for 24 hours and imaged with the standard eGFP (green) and rhodamine (red) fluorescence filter set. Arrows point to large clofazimine inclusions lacking green fluorescence (whereas small inclusions are visibly fluorescent). Nile Red staining (NR) of CFZ treated vs. untreated samples were acquired and displayed under the same exposure settings, showing significantly greater NR fluorescence in association with clofazimine inclusions.
Figure 2
Figure 2
Confocal Raman imaging of clofazimine-treated cells. A) Polynomial fitting of a representative, raw spectral scan acquired from a clofazimine treated cell. B) Background subtracted Raman vibrational spectra from A. C) The spectral intensity map of a selected fluorescence spectral region (2199 – 2296 cm−1), highlighted in blue in panel A. D) The spectral map of the selected, background subtracted, Raman spectral region (1100 – 1600 cm−1), highlighted in blue in panel B. E) spectra of various regions of in D (1: cytosol, 2: perinuclear region, 3: center of the nucleus, 4: perinuclear region; 5: center of the nucleus; 6–8: various punctate cytoplasmic foci. F) Representative, fluorescence-subtracted Raman spectra of untreated MDCK cells (a); clofazimine precipitates in different buffer solutions (b – g); dry clofazimine crystals (h); and, drug-treated cells (i). The intensity is in arbitrary units, normalized to the same scale. 1436 and 1461 cm−1 (*) are vibrational peaks that are prominent in crystalline clofazimine but almost absent the amorphous clofazimine (bold line).
Figure 3
Figure 3
TEM images of control cells (A, vehicle-only with 5% FBS-DMEM after 24 hr treatment); and cells incubated with 10 μM clofazimine for 24 hr (B) or 87 hr (C). D, E, and F are zoom-in of boxed regions in A, B, and C, respectively. Cytoplasmic objects were categorized into autophagosome-like drug inclusions (aldis) if they did not show characteristic features of the typical organelles, while exhibiting lipid-rich (lamellar or vesicular) internal structures stained with osmium tetroxide.
Figure 4
Figure 4
Temporal analysis of aldi biogenesis and mitochondria degeneration. A) Representative image of osmiophilic and granular multivesicular body that appears during the first 24 hr incubation. B) Early aldi, showing internal lamellae and heterogeneous appearance C) More complex aldi representative of those that appeared at latter time points. D) Measured frequency of different organelles, at various time points after beginning of clofazimine incubation. E) TEM images of abnormal/degenerating mitochondria in clofazimine treated cells. F) Frequency of normal vs. degenerating mitochondria changes during drug treatment. For TEM organelle counts, morphological features were manually scored from 6 or more cells.
Figure 5
Figure 5
Clofazimine associates with mitochondria, followed by dissipation of the mitochondrial membrane potential. A) MitoTracker Red (MTR) staining of untreated vs. clofazimine treated cells. Arrows at 21 hr treatment indicate clofazimine fluorescence (green channel) colocalized with functional mitochondria (labeled with MTR signal in red channel). However, the larger (older) clofazimine inclusions do not stain with MTR. (B) Clofazimine binds to isolated mitochondria. As a control, the same experiment was repeated with storage buffer alone and no mitochondria (w/o mito). Under control conditions, clofazimine signal was not detected in the pellet after centrifugation. Error bar represents standard deviation from representative experiment. Student’s T-test show statistically significant differences in both supernatant and pellet (p<0.05; N=2). C) Oxygen consumption rate (OCR) differences of clofazimine-treated cells (◆) vs. control cells ( formula image
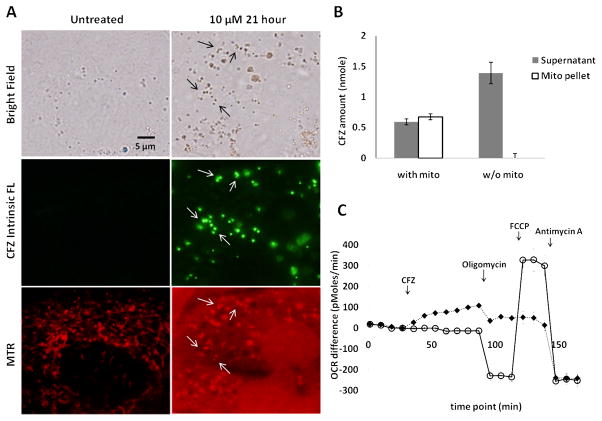
). Various inhibitors of mitochondrial respiration were sequentially applied in the presence or absence of clofazimine at pre-determined time points, as indicated in x-axis. The OCR difference was calculated as the measured OCR level minus the baseline OCR level (at the 27th minute). Error bars indicate s.e.m; N=3 (the error bar may be smaller than marks). Statistical significance for each treatment was tested comparing the last data point before vs. the new treatment’s last data point: 4th point vs. 11th point for clofazimine effect, 11th vs. 14th for oligomycin, 14th vs. 17th for FCCP, and 17th vs. 20th for Antimycin A. For every treatment, p < 0.05.

References

    1. Rajendran L, Knolker HJ, Simons K. Subcellular targeting strategies for drug design and delivery. Nat Rev Drug Discov. 2010;9:29–42. - PubMed
    1. Zhang X, Shedden K, Rosania GR. A cell-based molecular transport simulator for pharmacokinetic prediction and cheminformatic exploration. Mol Pharmaceutics. 2006;3:704–16. - PMC - PubMed
    1. Zheng N, Tsai HN, Zhang X, Rosania GR. The subcellular distribution of small molecules: from pharmacokinetics to synthetic biology. Mol Pharmaceutics. 2011 (Submitted for publication) - PMC - PubMed
    1. de Duve C, de Barsy T, Poole B, Trouet A, Tulkens P, Vanhoof F. Lysosomotropic Agents. Biochemical Pharmacology. 1974;23:2495. - PubMed
    1. Zheng N, Zhang X, Rosania GR. Effect of phospholipidosis on the cellular pharmacokinetics of chloroquine. J Pharmacol Exp Ther. 2010;336:661–71. - PMC - PubMed

Publication types

MeSH terms