

Global transcription regulation of RK2 plasmids: a case study in the combined use of dynamical mathematical models and statistical inference for integration of experimental data and hypothesis exploration
- PMID: 21801369
- PMCID: PMC3199767
- DOI: 10.1186/1752-0509-5-119
Global transcription regulation of RK2 plasmids: a case study in the combined use of dynamical mathematical models and statistical inference for integration of experimental data and hypothesis exploration
Abstract
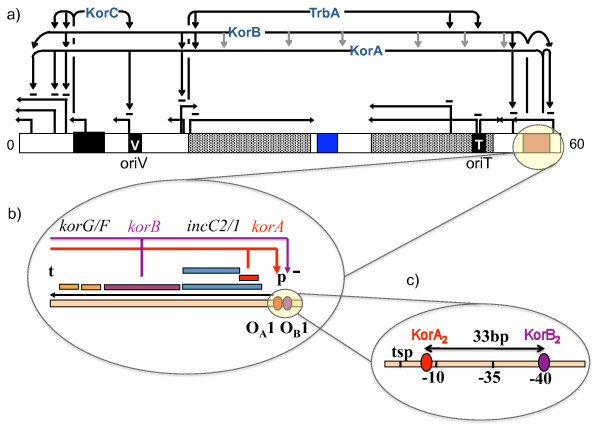
Background: IncP-1 plasmids are broad host range plasmids that have been found in clinical and environmental bacteria. They often carry genes for antibiotic resistance or catabolic pathways. The archetypal IncP-1 plasmid RK2 is a well-characterized biological system, with a fully sequenced and annotated genome and wide range of experimental measurements. Its central control operon, encoding two global regulators KorA and KorB, is a natural example of a negatively self-regulated operon. To increase our understanding of the regulation of this operon, we have constructed a dynamical mathematical model using Ordinary Differential Equations, and employed a Bayesian inference scheme, Markov Chain Monte Carlo (MCMC) using the Metropolis-Hastings algorithm, as a way of integrating experimental measurements and a priori knowledge. We also compared MCMC and Metabolic Control Analysis (MCA) as approaches for determining the sensitivity of model parameters.
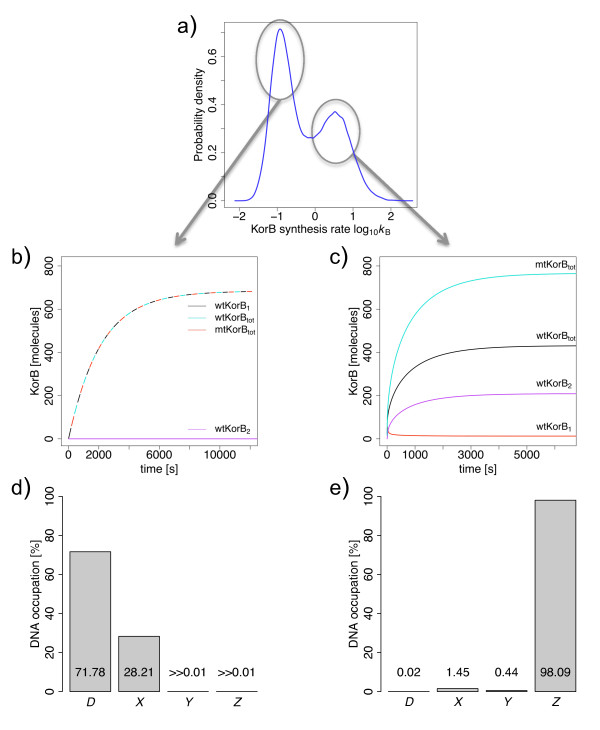
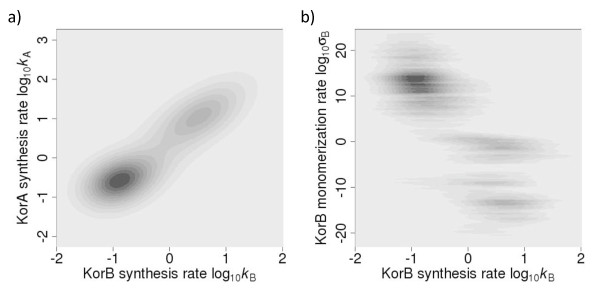
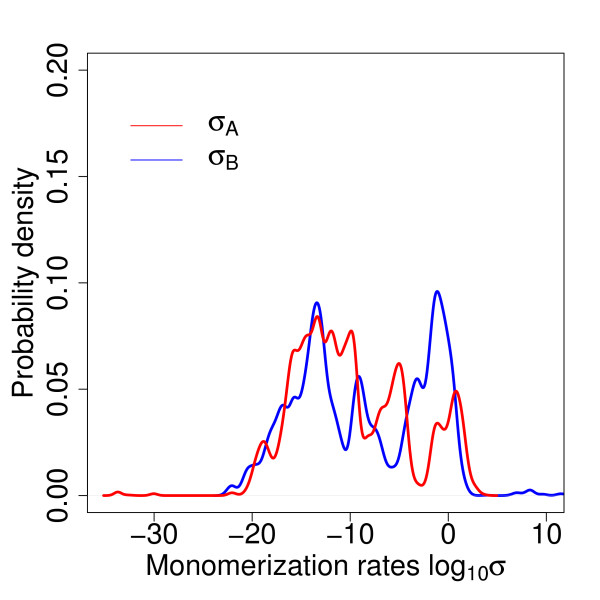
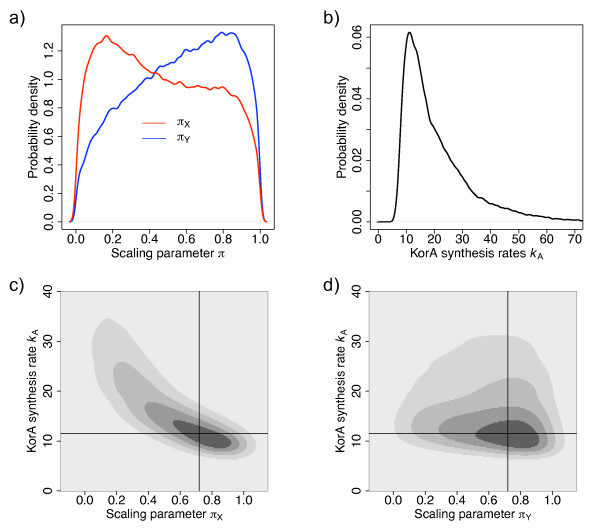
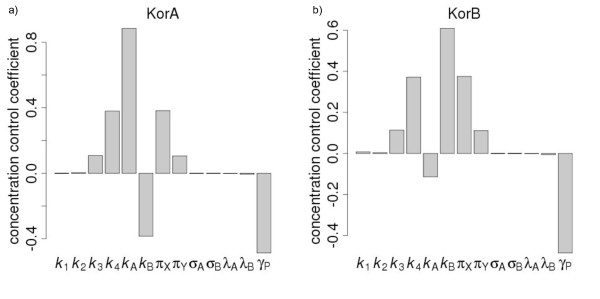
Results: We identified two distinct sets of parameter values, with different biological interpretations, that fit and explain the experimental data. This allowed us to highlight the proportion of repressor protein as dimers as a key experimental measurement defining the dynamics of the system. Analysis of joint posterior distributions led to the identification of correlations between parameters for protein synthesis and partial repression by KorA or KorB dimers, indicating the necessary use of joint posteriors for correct parameter estimation. Using MCA, we demonstrated that the system is highly sensitive to the growth rate but insensitive to repressor monomerization rates in their selected value regions; the latter outcome was also confirmed by MCMC. Finally, by examining a series of different model refinements for partial repression by KorA or KorB dimers alone, we showed that a model including partial repression by KorA and KorB was most compatible with existing experimental data.
Conclusions: We have demonstrated that the combination of dynamical mathematical models with Bayesian inference is valuable in integrating diverse experimental data and identifying key determinants and parameters for the IncP-1 central control operon. Moreover, we have shown that Bayesian inference and MCA are complementary methods for identification of sensitive parameters. We propose that this demonstrates generic value in applying this combination of approaches to systems biology dynamical modelling.
Figures
Similar articles
-
Identification of a seventh operon on plasmid RK2 regulated by the korA gene product.Gene. 1990 Apr 30;89(1):29-35. doi: 10.1016/0378-1119(90)90202-3. Gene. 1990. PMID: 2197180
-
Conserved C-terminal region of global repressor KorA of broad-host-range plasmid RK2 is required for co-operativity between KorA and a second RK2 global regulator, KorB.J Mol Biol. 1999 Jun 4;289(2):211-21. doi: 10.1006/jmbi.1999.2761. J Mol Biol. 1999. PMID: 10366500
-
Gene control in broad host range plasmid RK2: expression, polypeptide product, and multiple regulatory functions of korB.Proc Natl Acad Sci U S A. 1986 Jan;83(2):394-8. doi: 10.1073/pnas.83.2.394. Proc Natl Acad Sci U S A. 1986. PMID: 3455777 Free PMC article.
-
Bayesian inference.Methods Mol Biol. 2013;930:597-636. doi: 10.1007/978-1-62703-059-5_25. Methods Mol Biol. 2013. PMID: 23086859 Review.
-
Replication and partitioning of the broad-host-range plasmid RK2.Plasmid. 2010 Nov;64(3):119-34. doi: 10.1016/j.plasmid.2010.06.004. Epub 2010 Jul 1. Plasmid. 2010. PMID: 20600283 Review.
Cited by
-
Adaptation for protein synthesis efficiency in a naturally occurring self-regulating operon.PLoS One. 2012;7(11):e49678. doi: 10.1371/journal.pone.0049678. Epub 2012 Nov 20. PLoS One. 2012. PMID: 23185406 Free PMC article.
-
Reconsidering plasmid maintenance factors for computational plasmid design.Comput Struct Biotechnol J. 2018 Dec 15;17:70-81. doi: 10.1016/j.csbj.2018.12.001. eCollection 2019. Comput Struct Biotechnol J. 2018. PMID: 30619542 Free PMC article. Review.
-
A bayesian approach for parameterizing and predicting plasmid conjugation dynamics.Sci Rep. 2025 Mar 3;15(1):7396. doi: 10.1038/s41598-024-82799-5. Sci Rep. 2025. PMID: 40032848 Free PMC article.
-
The dynamic balance of import and export of zinc in Escherichia coli suggests a heterogeneous population response to stress.J R Soc Interface. 2015 May 6;12(106):20150069. doi: 10.1098/rsif.2015.0069. J R Soc Interface. 2015. PMID: 25808337 Free PMC article.
-
Plasmid Detection, Characterization, and Ecology.Microbiol Spectr. 2015 Feb;3(1):PLAS-0038-2014. doi: 10.1128/microbiolspec.PLAS-0038-2014. Microbiol Spectr. 2015. PMID: 26104560 Free PMC article. Review.
References
-
- Thomas CM. The horizontal Gene Pool: bacterial plasmids and gene spread. Amsterdam: Harwood Academic Publishers; 2000.
-
- Bahl MI, Hansen LH, Goesmann A, Sorensen SJ. The multiple antibiotic resistance IncP-1 plasmid pKJK5 isolated form a solid environment is phylogenetically divergent from members of the previously established α, β, δ sub-groups. Plasmid. 2007;58(1):31–43. doi: 10.1016/j.plasmid.2006.11.007. - DOI - PubMed
-
- Sambrook J, Russell DW. Molecular cloning: a laboratory manual. 3. New York: Cold Spring Harbor Laboratory Press; 2001.
-
- Bennett PM, Grinsted J. Microbiology. Vol. 17. New York: Academic Press; 1984. Plasmid Technology Methods.
Publication types
MeSH terms
Grants and funding
LinkOut - more resources
Full Text Sources
