

Three-dimensional characterization of regional lung deformation
- PMID: 21802086
- PMCID: PMC3443473
- DOI: 10.1016/j.jbiomech.2011.06.009
Three-dimensional characterization of regional lung deformation
Abstract
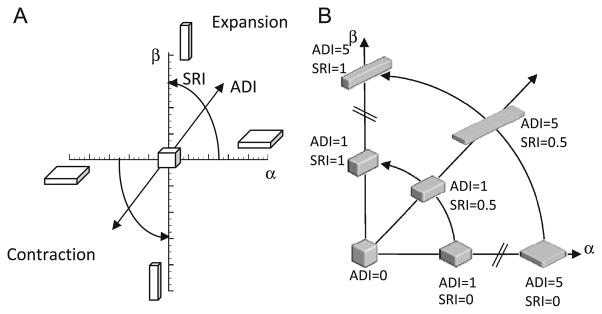
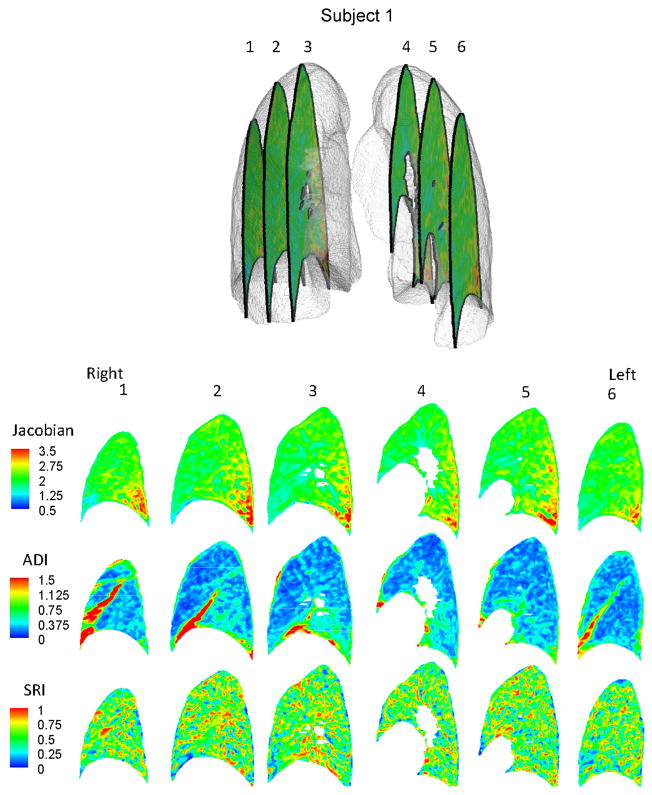
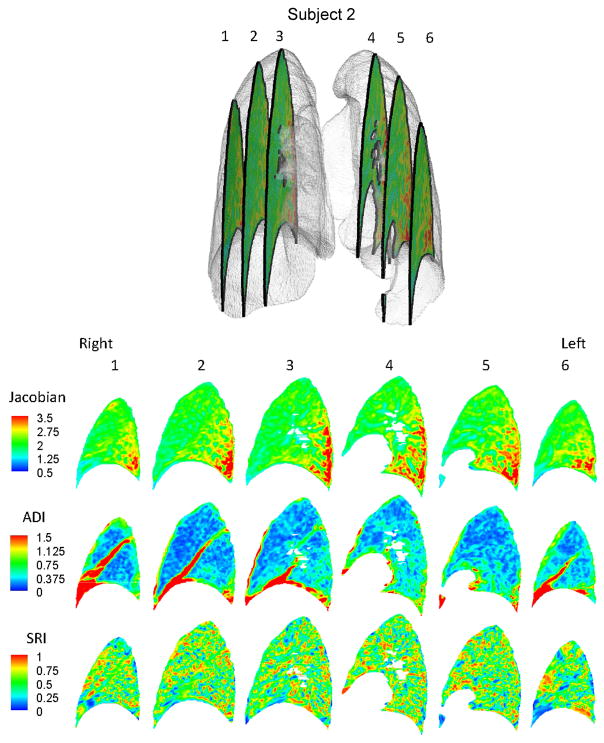
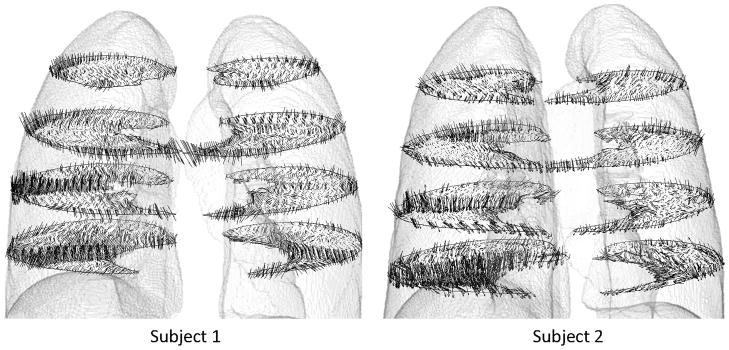
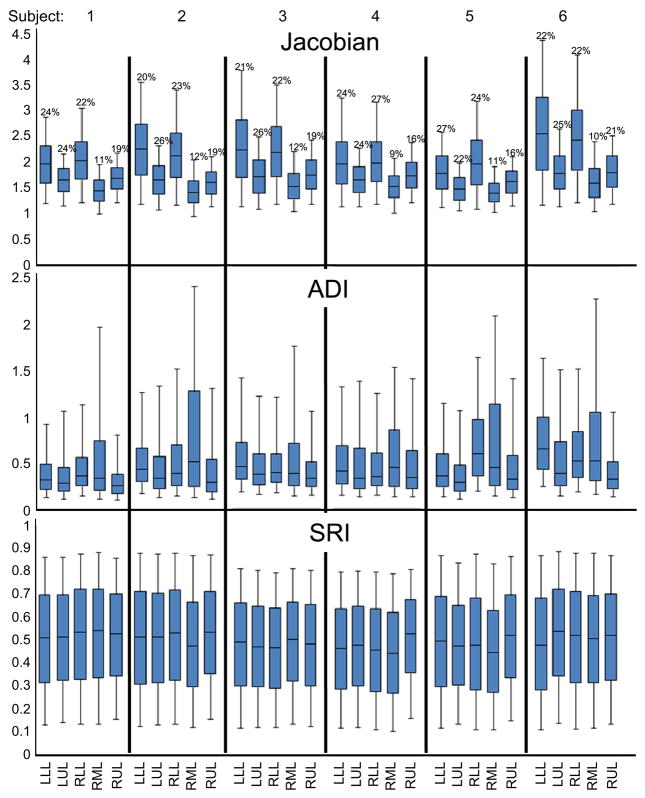
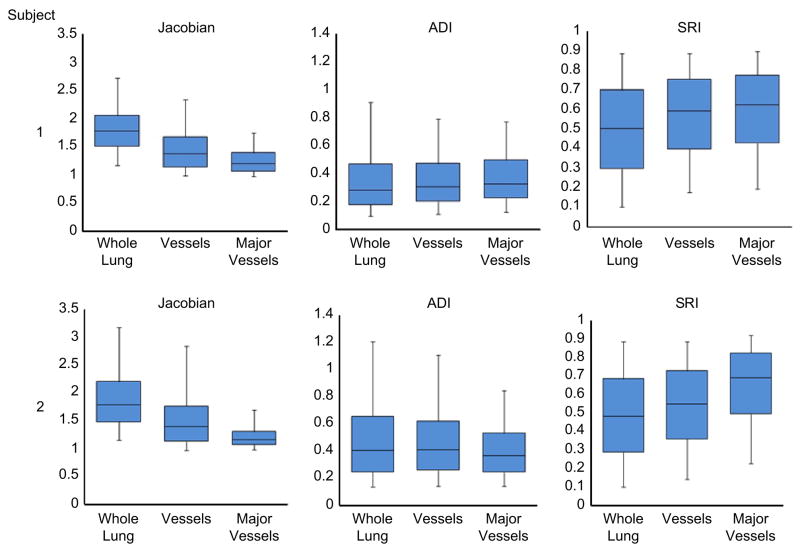
The deformation of the lung during inspiration and expiration involves regional variations in volume change and orientational preferences. Studies have reported techniques for measuring the displacement field in the lung based on imaging or image registration. However, means of interpreting all the information in the displacement field in a physiologically relevant manner is lacking. We propose three indices of lung deformation that are determinable from the displacement field: the Jacobian--a measure of volume change, the anisotropic deformation index--a measure of the magnitude of directional preference in volume change and a slab-rod index--a measure of the nature of directional preference in volume change. To demonstrate the utility of these indices, they were determined for six human subjects using deformable image registration on static CT images, registered from FRC to TLC. Volume change was elevated in the inferior-dorsal region as should be expected for breathing in the supine position. The anisotropic deformation index was elevated in the inferior region owing to proximity to the diaphragm and in the lobar fissures owing to sliding. Vessel regions in the lung had a significantly rod-like deformation compared to the whole lung. Compared to upper lobes, lower lobes exhibited significantly greater volume change (19.4% and 21.3% greater in the right and left lungs on average; p<0.005) and anisotropy in deformation (26.3% and 21.8% greater in the right and left lungs on average; p<0.05) with remarkable consistency across subjects. The developed deformation indices lend themselves to exhaustive and physiologically intuitive interpretations of the displacement fields in the lung determined through image-registration techniques or finite element simulations.
Copyright © 2011 Elsevier Ltd. All rights reserved.
Conflict of interest statement
Dr. Reinhardt is a founder and shareholder of VIDA Diagnostics, Inc.
Figures
References
-
- Bailey TC, Martin EL, Zhao L, Veldhuizen RA. High oxygen concentrations predispose mouse lungs to the deleterious effects of high stretch ventilation. J Appl Physiol. 2003;94(3):975–82. - PubMed
-
- Brock KK. Results of a multi-institution deformable registration accuracy study (MIDRAS) Int J Radiat Oncol Biol Phys. 2010;76(2):583–96. - PubMed
-
- Cao K, Ding K, Christensen GE, Reinhardt JM. Tissue volume and vesselness measure preserving nonrigid registration of lung CT images. SPIE 2010
-
- Chu EK, Whitehead T, Slutsky AS. Effects of cyclic opening and closing at low- and high-volume ventilation on bronchoalveolar lavage cytokines. Crit Care Med. 2004;32(1):168–74. - PubMed
Publication types
MeSH terms
Grants and funding
LinkOut - more resources
Full Text Sources
