

Amplitude and timing of somatosensory cortex activity in task-specific focal hand dystonia
- PMID: 21802357
- PMCID: PMC3327722
- DOI: 10.1016/j.clinph.2011.05.020
Amplitude and timing of somatosensory cortex activity in task-specific focal hand dystonia
Abstract
Objective: Task-specific focal hand dystonia (tspFHD) is a movement disorder diagnosed in individuals performing repetitive hand behaviors. The extent to which processing anomalies in primary sensory cortex extend to other regions or across the two hemispheres is presently unclear.
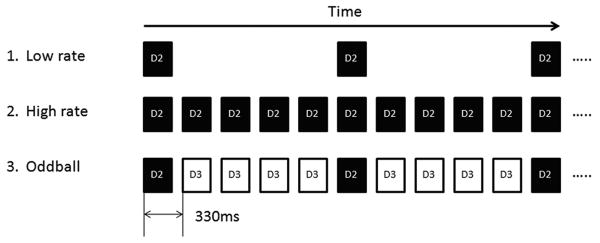
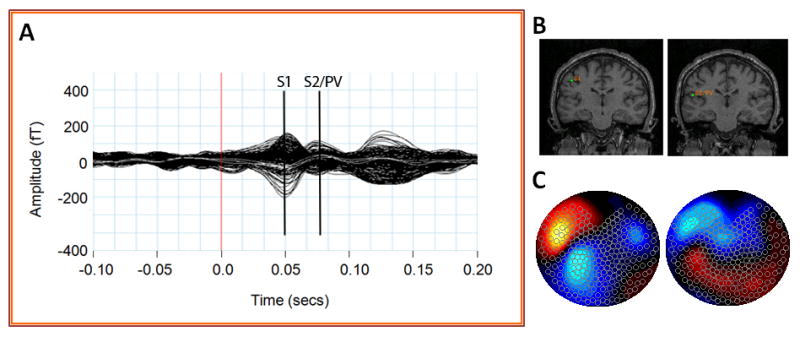
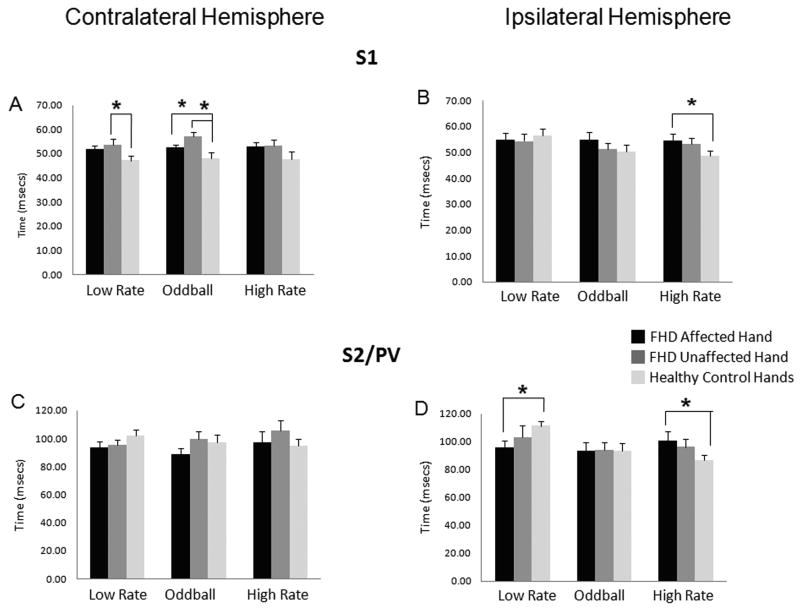
Methods: In response to low/high rate and novel tactile stimuli on the affected and unaffected hands, magnetoencephalography (MEG) was used to elaborate activity timing and amplitude in the primary somatosensory (S1) and secondary somatosensory/parietal ventral (S2/PV) cortices. MEG and clinical performance measures were collected from 13 patients and matched controls.
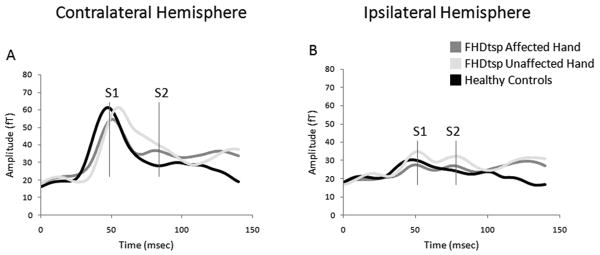
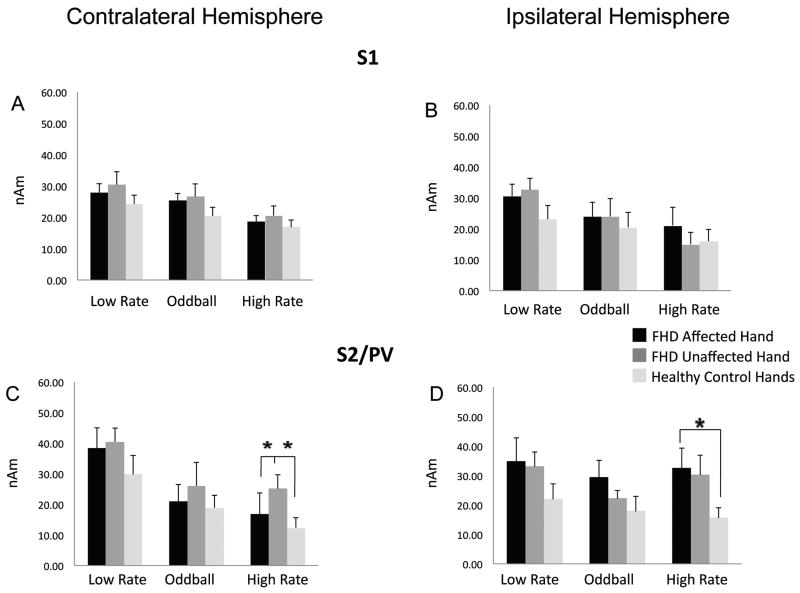
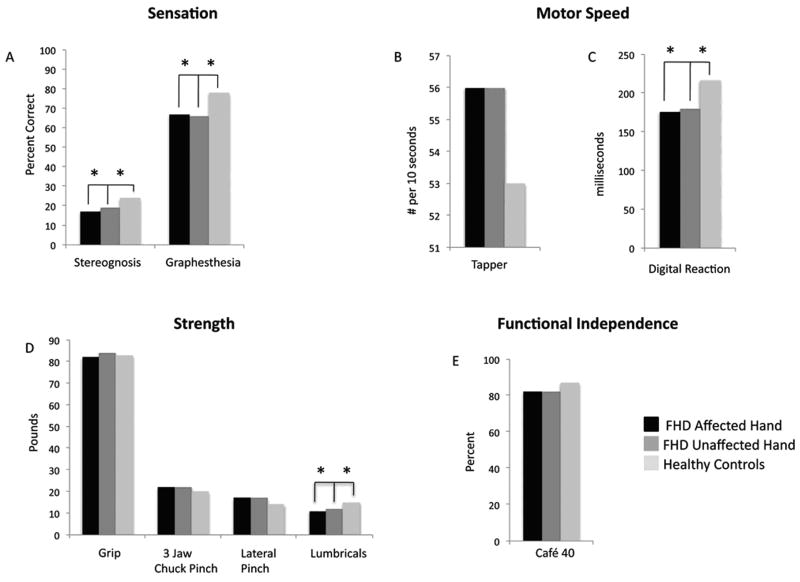
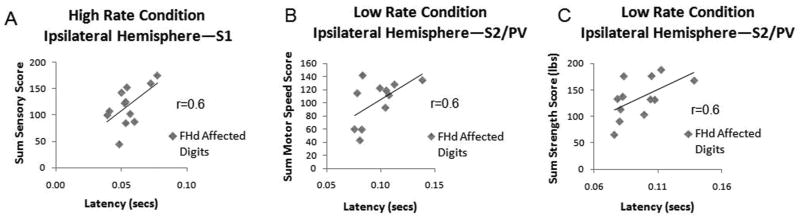
Results: Compared to controls, subjects with tspFHD had increased response amplitude in S2/PV bilaterally in response to high rate and novel stimuli. Subjects with tspFHD also showed increased response latency (low rate, novel) of the affected digits in contralateral S1. For high rate, subjects with tspFHD showed increased response latency in ipsilateral S1 and S2/PV bilaterally. Activation differences correlated with functional sensory deficits (predicting a latency shift in S1), motor speed and muscle strength.
Conclusions: There are objective differences in the amplitude and timing of activity for both hands across contralateral and ipsilateral somatosensory cortex in patients with tspFHD.
Significance: Knowledge of cortical processing abnormalities across S1 and S2/PV in dystonia should be applied towards the development of learning-based sensorimotor interventions.
Copyright © 2011 International Federation of Clinical Neurophysiology. Published by Elsevier Ireland Ltd. All rights reserved.
Figures
Similar articles
-
Movement-induced uncoupling of primary sensory and motor areas in focal task-specific hand dystonia.Neuroscience. 2013 Oct 10;250:434-45. doi: 10.1016/j.neuroscience.2013.07.027. Epub 2013 Jul 20. Neuroscience. 2013. PMID: 23876327
-
Somatosensory representation of the digits and clinical performance in patients with focal hand dystonia.Am J Phys Med Rehabil. 2003 Oct;82(10):737-49. doi: 10.1097/01.PHM.0000087458.32122.14. Am J Phys Med Rehabil. 2003. PMID: 14508403
-
Correlation of clinical neuromusculoskeletal and central somatosensory performance: variability in controls and patients with severe and mild focal hand dystonia.Neural Plast. 2002;9(3):177-203. doi: 10.1155/NP.2002.177. Neural Plast. 2002. PMID: 12757370 Free PMC article.
-
Neuroimaging characteristics of patients with focal hand dystonia.J Hand Ther. 2009 Apr-Jun;22(2):125-34; quiz 135. doi: 10.1016/j.jht.2008.11.002. Epub 2009 Feb 12. J Hand Ther. 2009. PMID: 19217255 Free PMC article. Review.
-
The pathophysiology of focal hand dystonia.J Hand Ther. 2009 Apr-Jun;22(2):109-13; quiz 114. doi: 10.1016/j.jht.2008.10.008. Epub 2009 Feb 12. J Hand Ther. 2009. PMID: 19216051 Free PMC article. Review.
Cited by
-
Reduced functional connectivity of somatosensory network in writer's cramp patients.Brain Behav. 2016 Jan 26;6(3):e00433. doi: 10.1002/brb3.433. eCollection 2016 Mar. Brain Behav. 2016. PMID: 26839735 Free PMC article.
-
Complex-value coherence mapping reveals novel abnormal resting-state functional connectivity networks in task-specific focal hand dystonia.Front Neurol. 2013 Oct 10;4:149. doi: 10.3389/fneur.2013.00149. eCollection 2013. Front Neurol. 2013. PMID: 24133480 Free PMC article.
-
Cause or effect: Altered brain and network activity in cervical dystonia is partially normalized by botulinum toxin treatment.Neuroimage Clin. 2019;22:101792. doi: 10.1016/j.nicl.2019.101792. Epub 2019 Mar 26. Neuroimage Clin. 2019. PMID: 30928809 Free PMC article. Clinical Trial.
-
Brain Connectivity in Dystonia: Evidence from Magnetoencephalography.Adv Neurobiol. 2023;31:141-155. doi: 10.1007/978-3-031-26220-3_8. Adv Neurobiol. 2023. PMID: 37338700 Review.
-
Increased cortico-striatal connectivity during motor practice contributes to the consolidation of motor memory in writer's cramp patients.Neuroimage Clin. 2015 Apr 22;8:180-92. doi: 10.1016/j.nicl.2015.04.013. eCollection 2015. Neuroimage Clin. 2015. PMID: 26106542 Free PMC article.
References
-
- Altenmüller E, Jabusch HC. Focal hand dystonia in musicians: phenomenology, etiology and psychological trigger factors. J Hand Ther. 2009;22(2):144–154. - PubMed
-
- Bara-Jimenez W, Shelton P, Sanger TD, Hallett M. Sensory discrimination capabilities in patients with focal hand dystonia. Ann Neurol. 2000;47:377–380. - PubMed
-
- Bara-Jiminez W, Shelton P, Hallett M. Spatial discrimination is abnormal in focal hand dystonia. Neurology. 2000;12:1869–1873. - PubMed
Publication types
MeSH terms
Grants and funding
LinkOut - more resources
Full Text Sources
