. 2012 Jan;89(1):14-20.
doi: 10.1016/j.biopsycho.2011.07.005. Epub 2011 Jul 28.

Physiological blunting during pregnancy extends to induced relaxation

Affiliations

Physiological blunting during pregnancy extends to induced relaxation

Janet A DiPietro et al. Biol Psychol. 2012 Jan.

Abstract

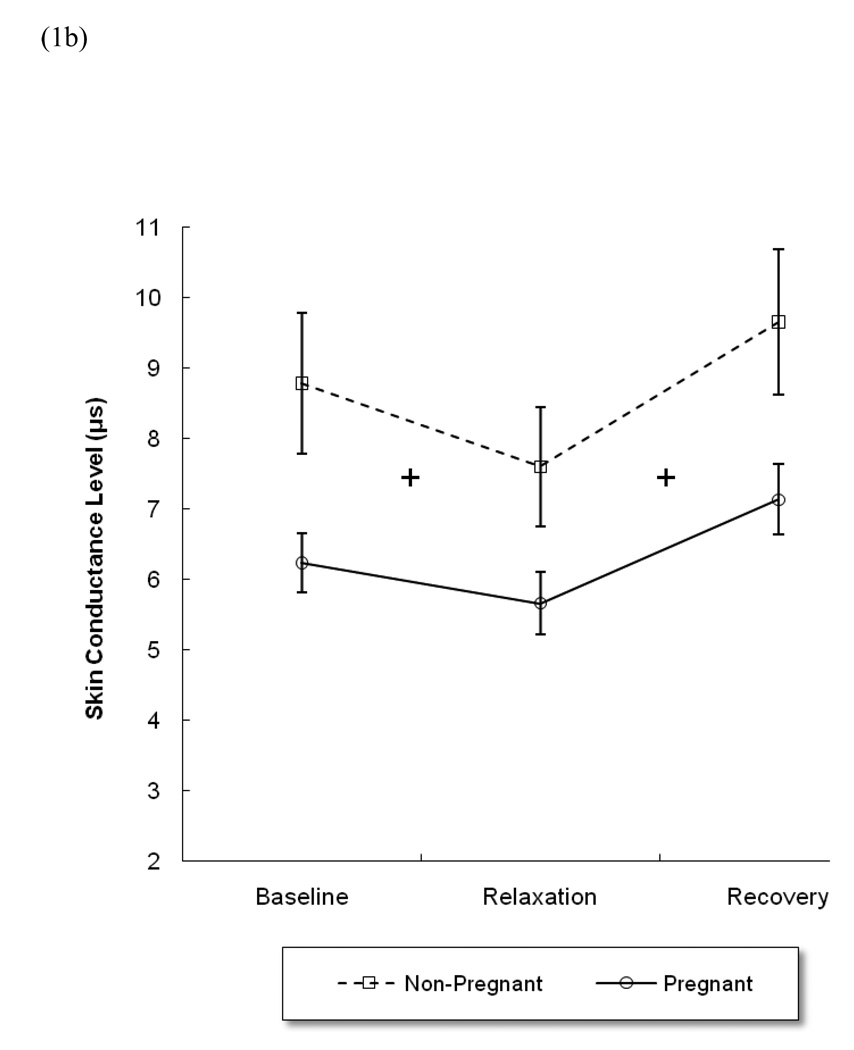
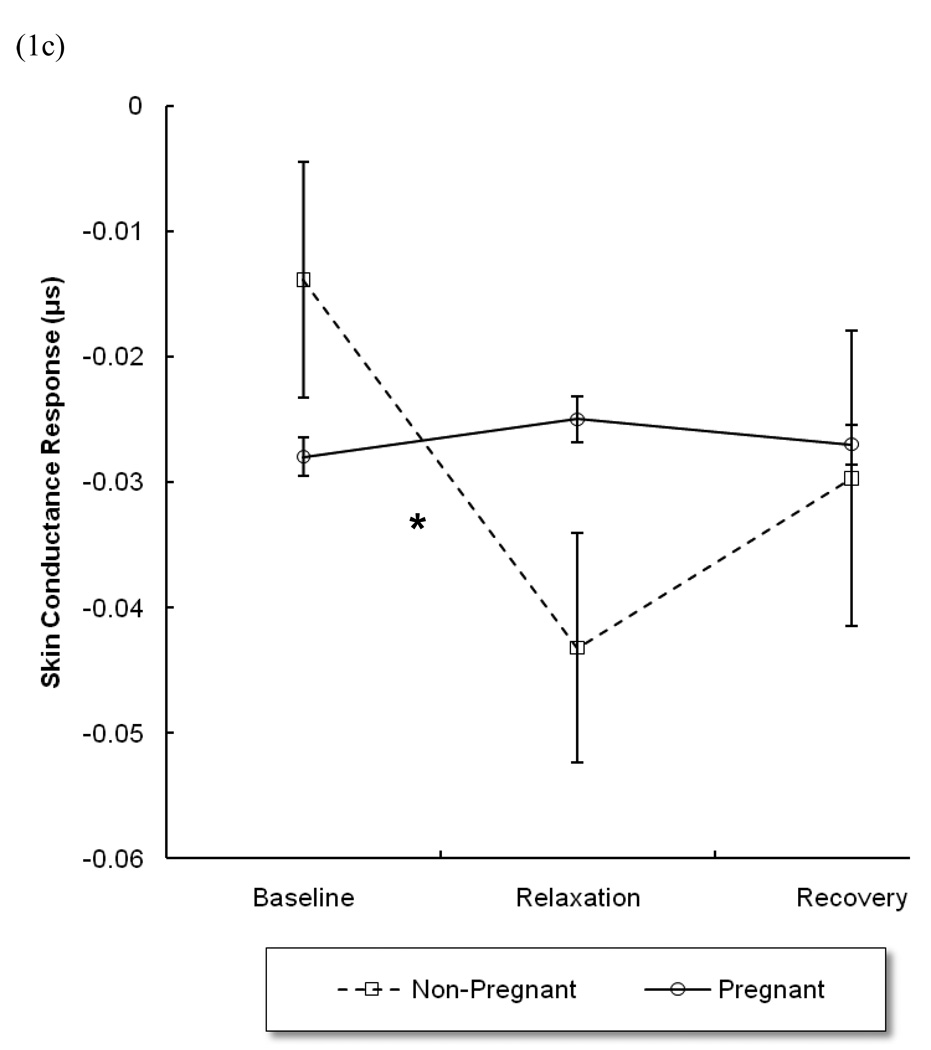
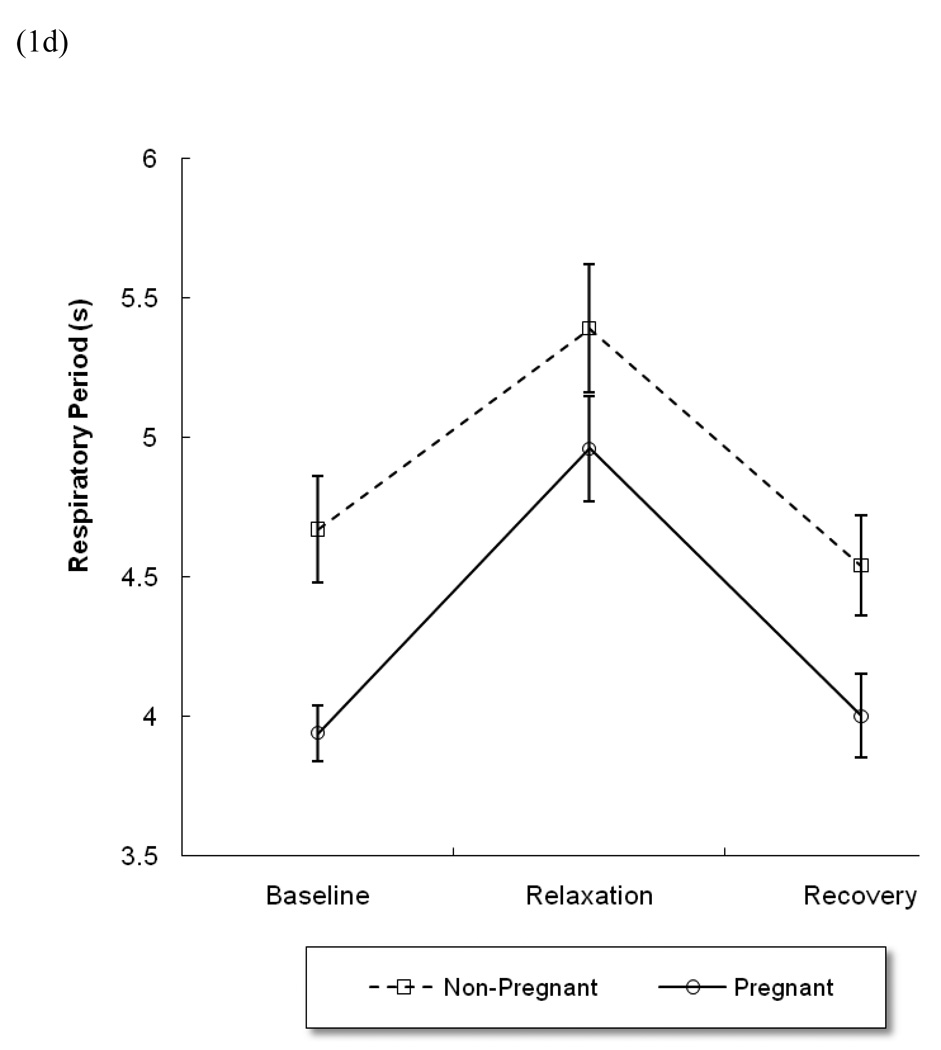
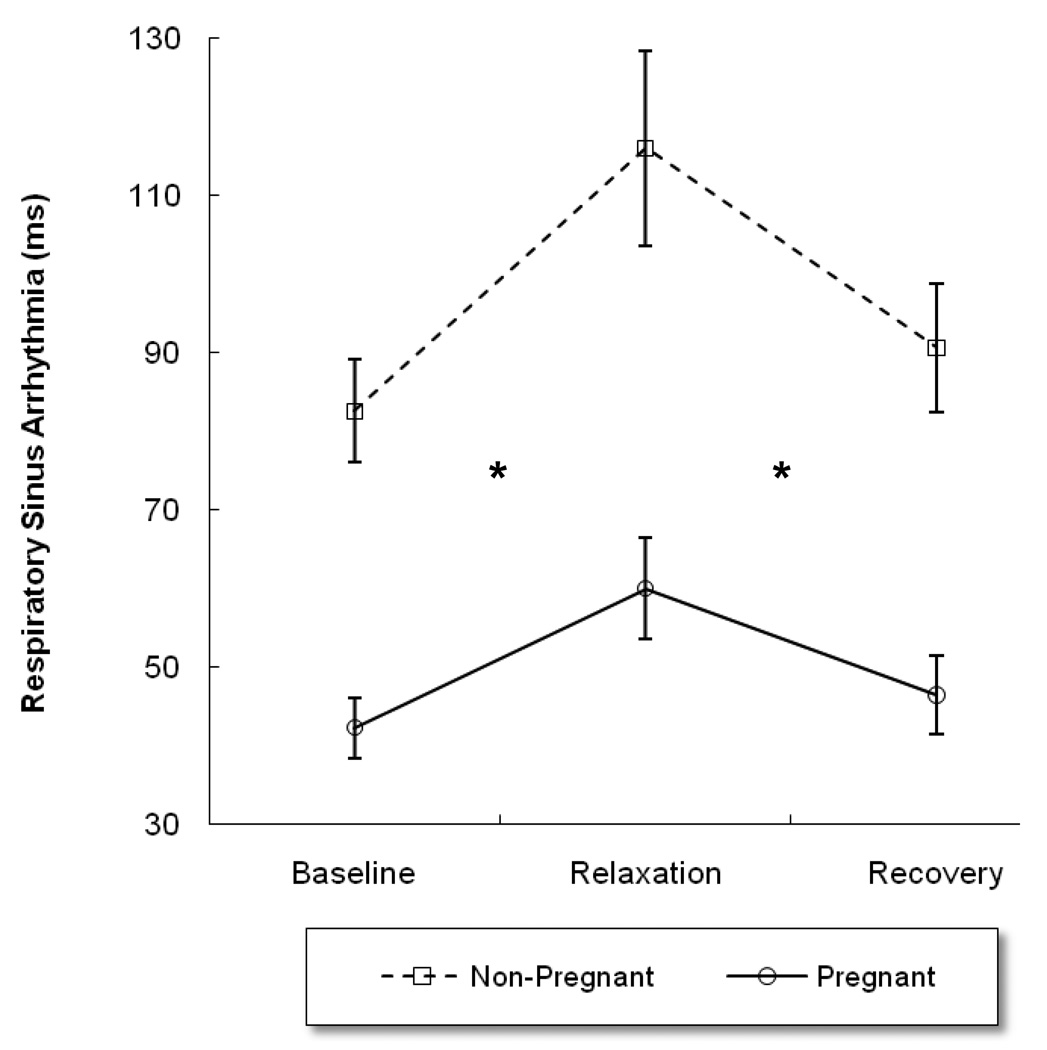
There is accumulating evidence that pregnancy is accompanied by hyporesponsivity to physical, cognitive, and psychological challenges. This study evaluates whether observed autonomic blunting extends to conditions designed to decrease arousal. Physiological and psychological responsivity to an 18-min guided imagery relaxation protocol in healthy pregnant women during the 32nd week of gestation (n=54) and non-pregnant women (n=28) was measured. Data collection included heart period (HP), respiratory sinus arrhythmia (RSA), tonic and phasic measures of skin conductance (SCL and NS-SCR), respiratory period (RP), and self-reported psychological relaxation. As expected, responses to the manipulation included increased HP, RSA, and RP and decreased SCL and NS-SCR, followed by post-manipulation recovery. However, responsivity was attenuated for all physiological measures except RP in pregnant women, despite no difference in self-reported psychological relaxation. Findings support non-specific blunting of physiological responsivity during pregnancy.


Figures

Figure 1
Figure 1
a. Mean heart period (HP) and standard error (SE) by pregnancy status from baseline through recovery. There were significant main effects for Time and Group. * indicates significant Group × Time interactions (i.e., differences in slope) during both responsivity and recovery segments. b. Mean skin conductance level (SCL) and standard error (SE) by pregnancy status from baseline through recovery. There were significant main effects for Time and Group. + indicates near significant (p < .10) Group × Time interactions during both responsivity and recovery segments. c. Mean non-specific skin conductance response (NS-SCR) by pregnancy status from baseline through recovery. Effects for Group and Time were not significant (Time p < .10). * indicate significant Group × Time interaction during responsivity. d. Mean respiratory period (RP) and standard error (SE) by pregnancy status from baseline through recovery. There were significant main effects for Time and Group but no significant Group × Time interactions. e. Mean respiratory sinus arrhythmia (RSA) standard error (SE) by pregnancy status from baseline through recovery. There were significant main effects for Time and Group across the segments. * indicates significant Group × Time interactions during both responsivity and recovery segments.
Figure 1
Figure 1
a. Mean heart period (HP) and standard error (SE) by pregnancy status from baseline through recovery. There were significant main effects for Time and Group. * indicates significant Group × Time interactions (i.e., differences in slope) during both responsivity and recovery segments. b. Mean skin conductance level (SCL) and standard error (SE) by pregnancy status from baseline through recovery. There were significant main effects for Time and Group. + indicates near significant (p < .10) Group × Time interactions during both responsivity and recovery segments. c. Mean non-specific skin conductance response (NS-SCR) by pregnancy status from baseline through recovery. Effects for Group and Time were not significant (Time p < .10). * indicate significant Group × Time interaction during responsivity. d. Mean respiratory period (RP) and standard error (SE) by pregnancy status from baseline through recovery. There were significant main effects for Time and Group but no significant Group × Time interactions. e. Mean respiratory sinus arrhythmia (RSA) standard error (SE) by pregnancy status from baseline through recovery. There were significant main effects for Time and Group across the segments. * indicates significant Group × Time interactions during both responsivity and recovery segments.
Figure 2
Figure 2
Mean Relaxation Inventory scores by pregnancy status and standard error (SE) from baseline to post-relaxation. There were no differences in reports of baseline level of relaxation or group differences in the psychological relaxation response.

Similar articles

Cited by

References

    1. Allen JJB, Chambers AS, Towers DN. The many metrics of cardiac chronotropy: A pragmatic primer and a brief comparison of metrics. Biological Psychology. 2007;74:243–262. - PubMed
    1. Baker F, Denniston M, Zabora J, Polland A, Dudley WN. A POMS short form for cancer patients: Psychometric and structural evaluation. Psycho-Oncology. 2002;11:273–281. - PubMed
    1. Barron W, Mujais S, Zinaman M, Bravo E, Lindheimer M. Plasma catecholamine responses to physiologic stimuli in normal human pregnancy. American Journal of Obstetrics and Gynecology. 1986;154:80–84. - PubMed
    1. Beddoe EA, Lee KA. Mind-body interventions during pregnancy. Journal of Obstetric, Gynecologic and Neonatal Nursing. 2008;37:165–175. - PubMed
    1. Berntson G, Cacioppo J, Quigley K. Respiratory sinus arrhythmia: Autonomic origins, physiological mechanisms, and psychophysiological implications. Psychophysiology. 1993;30:183–196. - PubMed

Publication types