. 2011 Oct;49(4):886-94.
doi: 10.1016/j.bone.2011.07.006. Epub 2011 Jul 19.

Variability of trabecular microstructure is age-, gender-, race- and anatomic site-dependent and affects stiffness and stress distribution properties of human vertebral cancellous bone

Affiliations

Variability of trabecular microstructure is age-, gender-, race- and anatomic site-dependent and affects stiffness and stress distribution properties of human vertebral cancellous bone

Yener N Yeni et al. Bone. 2011 Oct.

Abstract

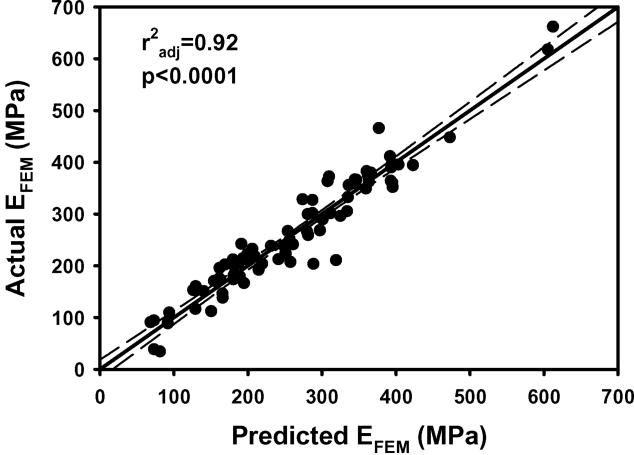
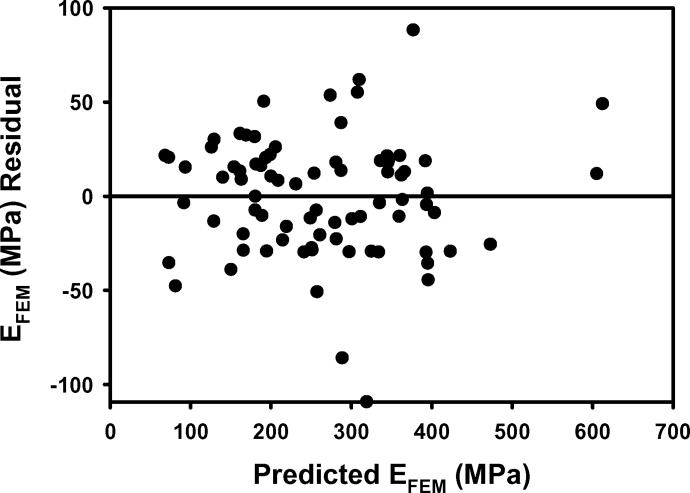
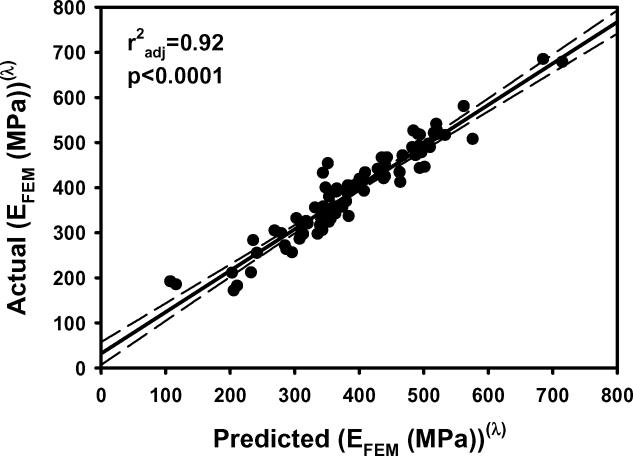
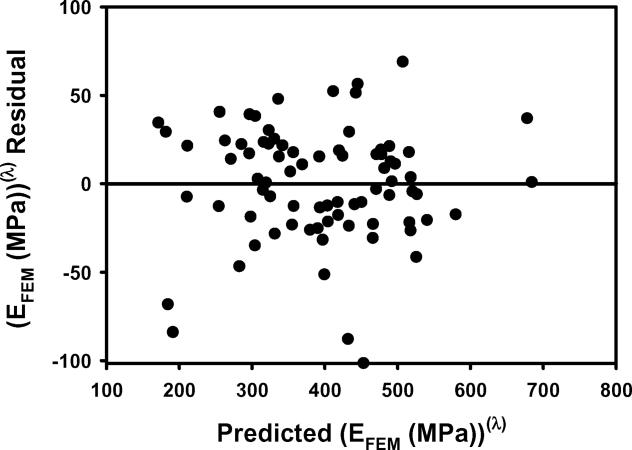
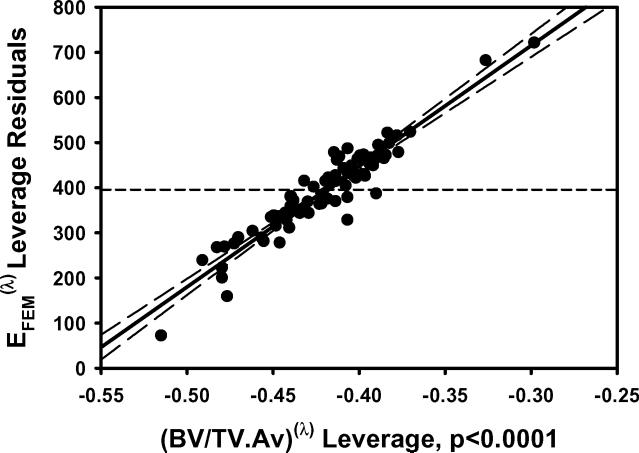
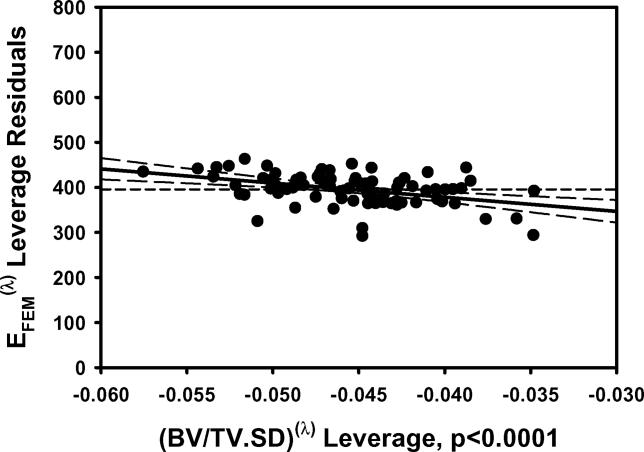
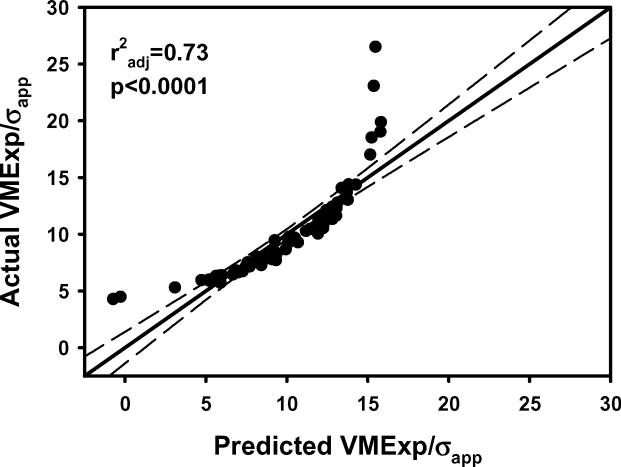
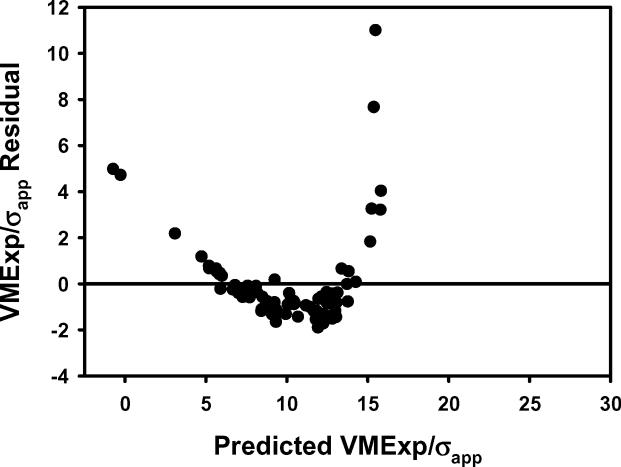
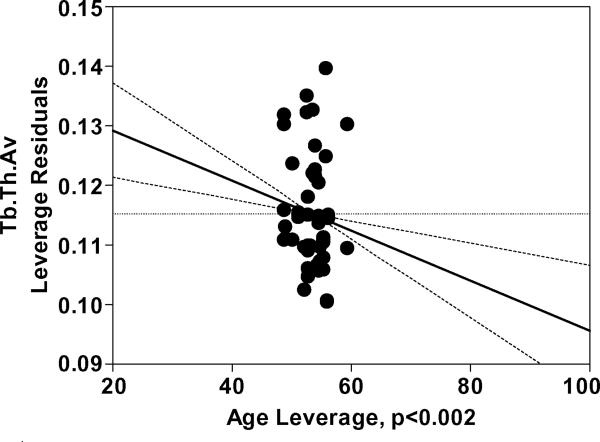
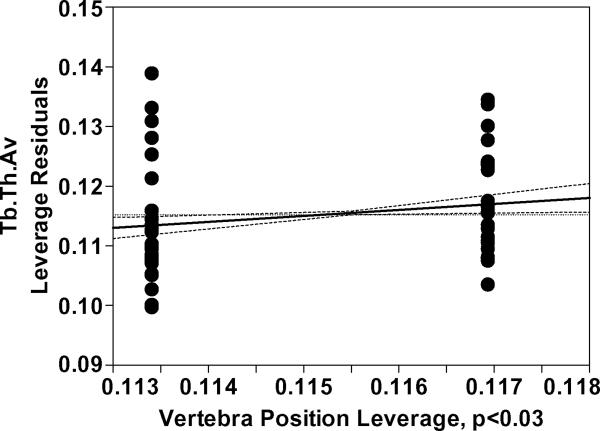
Cancellous bone microstructure is an important determinant of the mechanical integrity of vertebrae. The numerous microstructural parameters that have been studied extensively are generally represented as a single value obtained as an average over a sample. The range of the intra-sample variability of cancellous microstructure and its effect on the mechanical properties of bone are less well-understood. The objectives of this study were to investigate the extent to which human cancellous bone microstructure within a vertebra i) is related to bone modulus and stress distribution properties and ii) changes along with age, gender and locations thoracic 12 (T12) vs lumbar 1 (L1). Vertebrae were collected from 15 male (66±15 years) and 25 female (54±16 years) cadavers. Three dimensional finite element models were constructed using microcomputed tomography images of cylindrical specimens. Linear finite element models were used to estimate apparent modulus and stress in the cylinders during uniaxial compression. The intra-specimen mean, standard deviation (SD) and coefficient of variation (CV) of microstructural variables were calculated. Mixed model statistical analysis of the results demonstrated that increases in the intra-specimen variability of the microstructure contribute to increases in the variability of trabecular stresses and decreases in bone stiffness. These effects were independent from the contribution from intra-specimen average of the microstructure. Further, the effects of microstructural variability on bone stiffness and stress variability were not accounted for by connectivity and anisotropy. Microstructural variability properties (SD, CV) generally increased with age, were greater in females than in males and in T12 than in L1. Significant interactions were found between age, gender, vertebra and race. These interactions suggest that microstructural variability properties varied with age differently between genders, races and vertebral levels. The current results collectively demonstrate that microstructural variability has a significant effect on mechanical properties and tissue stress of human vertebral cancellous bone. Considering microstructural variability could improve the understanding of bone fragility and improve assessment of vertebral fracture risk.


Figures

Figure 1
Figure 1
a) EFEM calculated from finite element models vs EFEM predicted by the multiple regression model including BV/TV.Av and BV/TV.SD using nontransformed variables. b) The residuals for the model with nontransformed variables. c) As in 1a except using transformed variables. d) The residuals for the model with transformed variables. e) Leverage plot for BV/TV.Av and f) Leverage plot for BV/TV.SD. Solid, medium dashed and small dashed lines show linear fits, 95% confidence intervals and mean of the actual EFEM, respectively. (95% confidence curve crossing the mean response line indicates a significant leverage for the effect.) The model with transformed variables and that with nontransformed variables were qualitatively similar.
Figure 1
Figure 1
a) EFEM calculated from finite element models vs EFEM predicted by the multiple regression model including BV/TV.Av and BV/TV.SD using nontransformed variables. b) The residuals for the model with nontransformed variables. c) As in 1a except using transformed variables. d) The residuals for the model with transformed variables. e) Leverage plot for BV/TV.Av and f) Leverage plot for BV/TV.SD. Solid, medium dashed and small dashed lines show linear fits, 95% confidence intervals and mean of the actual EFEM, respectively. (95% confidence curve crossing the mean response line indicates a significant leverage for the effect.) The model with transformed variables and that with nontransformed variables were qualitatively similar.
Figure 2
Figure 2
The plots of a) VMExp/σapp calculated from finite element models vs VMExp/σapp predicted by the multiple regression model including BV/TV.Av and BV/TV.SD and b) the residuals indicated that the linear model fit was not appropriate. The transformation of variables resulted in an improved fit as indicated by the plots of c) calculated (VMExp/σapp)(λ) vs predicted (VMExp/σapp)(λ) app and d) the residuals from the model with transformed variables. e) Leverage plot for BV/TV.Av(λ) and f) leverage plot for BV/TV.SD(λ) in the transformed model. The model with transformed variables, unlike that with nontransformed variables, indicates a significant, albeit small, effect of BV/TV.SD on VMExp/σapp.
Figure 2
Figure 2
The plots of a) VMExp/σapp calculated from finite element models vs VMExp/σapp predicted by the multiple regression model including BV/TV.Av and BV/TV.SD and b) the residuals indicated that the linear model fit was not appropriate. The transformation of variables resulted in an improved fit as indicated by the plots of c) calculated (VMExp/σapp)(λ) vs predicted (VMExp/σapp)(λ) app and d) the residuals from the model with transformed variables. e) Leverage plot for BV/TV.Av(λ) and f) leverage plot for BV/TV.SD(λ) in the transformed model. The model with transformed variables, unlike that with nontransformed variables, indicates a significant, albeit small, effect of BV/TV.SD on VMExp/σapp.
Figure 3
Figure 3
a) Age leverage and b) Vertebra leverage plots for the reduced Tb.Th.Av model for females, constructed based on significant interactions found between age and gender in the main model (Table 4). The increasing direction of vertebra leverage is from T12 to L1. The results show a decrease in Tb.Th.Av with increasing age and a greater Tb.Th.Av in L1 than in T12 for females. The age and vertebra effects were nonsignificant (p>0.4 and p>0.8, respectively) in the model for males.
Figure 3
Figure 3
a) Age leverage and b) Vertebra leverage plots for the reduced Tb.Th.Av model for females, constructed based on significant interactions found between age and gender in the main model (Table 4). The increasing direction of vertebra leverage is from T12 to L1. The results show a decrease in Tb.Th.Av with increasing age and a greater Tb.Th.Av in L1 than in T12 for females. The age and vertebra effects were nonsignificant (p>0.4 and p>0.8, respectively) in the model for males.

Similar articles

Cited by

References

    1. Aaron JE, Makins NB, Sagreiya K. The microanatomy of trabecular bone loss in normal aging men and women. Clin Orthop Relat Res. 1987:260–71. - PubMed
    1. Andrews EW, Gibson LJ. The role of cellular structure in creep of two-dimensional cellular solids. Materials Science and Engineering a-Structural Materials Properties Microstructure and Processing. 2001;303:120–126.
    1. Bourne BC, van der Meulen MC. Finite element models predict cancellous apparent modulus when tissue modulus is scaled from specimen CT-attenuation. J Biomech. 2004;37:613–21. - PubMed
    1. Bouxsein ML, Melton LJ, 3rd, Riggs BL, Muller J, Atkinson EJ, Oberg AL, Robb RA, Camp JJ, Rouleau PA, McCollough CH, Khosla S. Age- and sex-specific differences in the factor of risk for vertebral fracture: a population-based study using QCT. J Bone Miner Res. 2006;21:1475–82. - PubMed
    1. Box GEP, Cox DR. An Analysis of Transformations. JRSS. 1964;B26:211–43.

Publication types