

Trends in energy intake among US children by eating location and food source, 1977-2006
- PMID: 21802561
- PMCID: PMC3148484
- DOI: 10.1016/j.jada.2011.05.007
Trends in energy intake among US children by eating location and food source, 1977-2006
Abstract
Background: Little is known about the influence of location of food consumption and preparation upon daily energy intake of children.
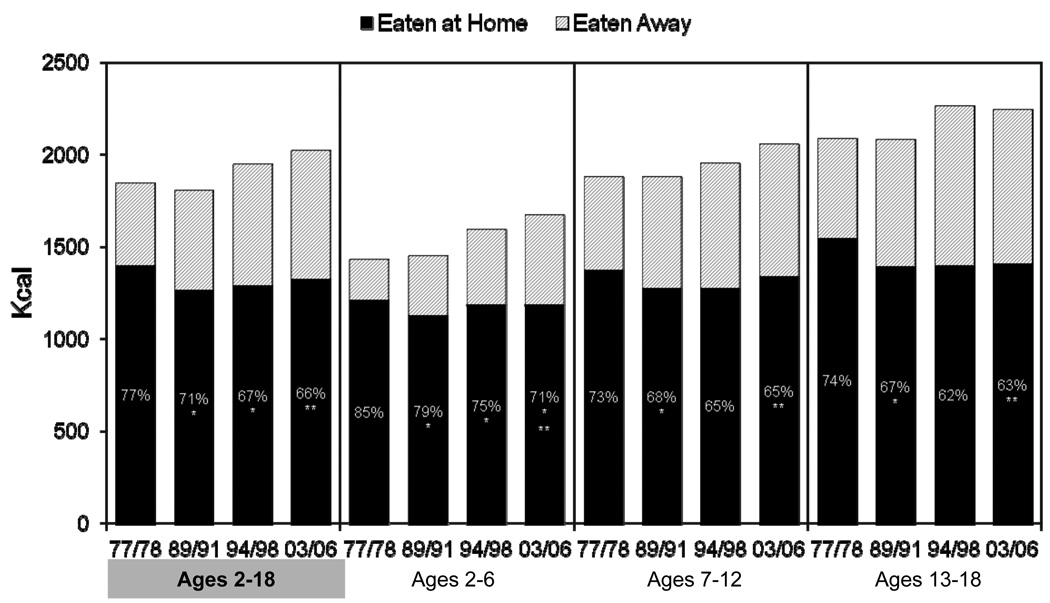
Objective: To examine trends in daily energy intake by children for foods eaten at home or away from home, by source of preparation, and for combined categories of eating location and food source.
Subjects: The analysis uses data from 29,217 children aged 2 to 18 years from the 1977-1978 Nationwide Food Consumption Survey, 1989-1991 and 1994-1998 Continuing Survey of Food Intakes by Individuals, and 2003-2006 National Health and Nutrition Examination Surveys.
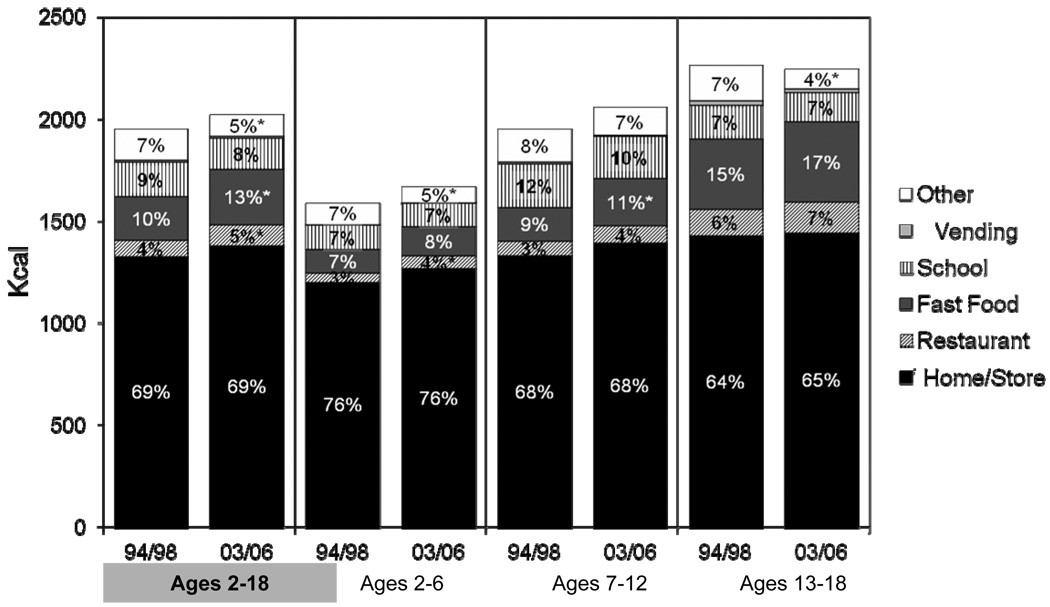
Methods: Nationally representative weighted percentages and means of daily energy intake by eating location were analyzed for trends from 1977 to 2006. Comparisons by food source were examined from 1994 to 2006. Analyses were repeated for three age groups: 2 to 6 years, 7 to 12 years, and 13 to 18 years. Difference testing was conducted using a t test.
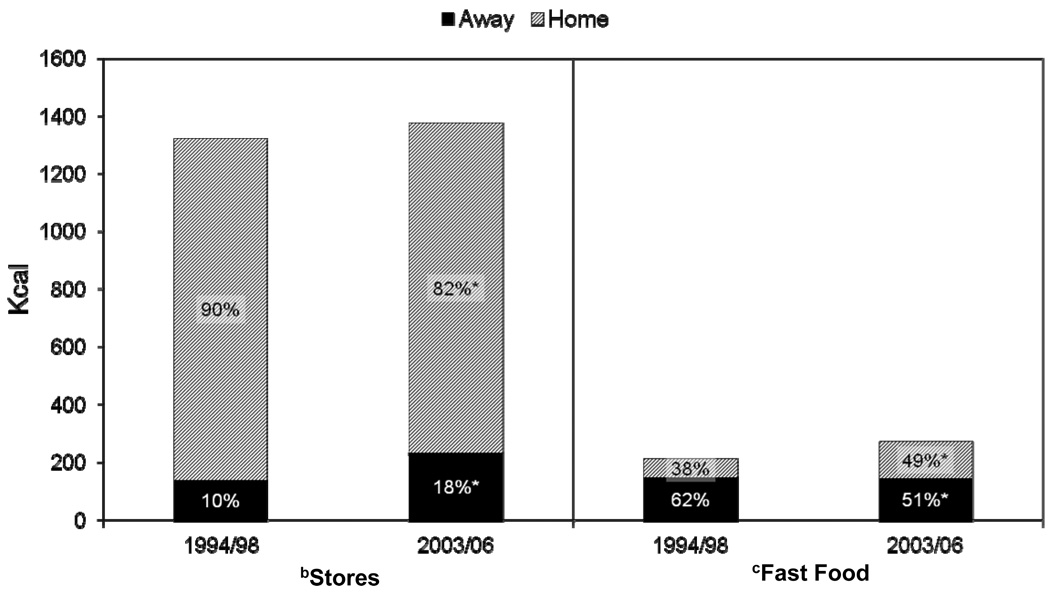
Results: Increased energy intake (+179 kcal/day) by children from 1977-2006 was associated with a major increase in energy eaten away from home (+255 kcal/day). The percentage of daily energy eaten away from home increased from 23.4% to 33.9% from 1977-2006. No further increase was observed from 1994-2006, but the sources of energy shifted. The percentage of energy from fast food increased to surpass intake from schools and become the largest contributor to foods prepared away from home for all age groups. For foods eaten away from home, the percentage of daily energy from stores increased to become the largest source of energy eaten away from home. Fast food eaten at home and store-bought food eaten away from home increased significantly.
Conclusions: Eating location and food source significantly influence daily energy intake for children. Foods prepared away from home, including fast food eaten at home and store-prepared food eaten away from home, are fueling the increase in total energy intake. However, further research using alternative data sources is necessary to verify that store-bought foods eaten away from home are increasingly store-prepared.
Copyright © 2011 American Dietetic Association. Published by Elsevier Inc. All rights reserved.
Figures
References
-
- Nielsen SJ, Siega-Riz AM, Popkin BM. Trends in energy intake in U.S. between 1977 and 1996: similar shifts seen across age groups. Obes Res. 2002;10(5):370–378. - PubMed
-
- Nielsen SJ, Siega-Riz AM, Popkin BM. Trends in food locations and sources among adolescents and young adults. Prev Med. 2002;35(2):107–113. - PubMed
-
- Nielsen SJ, Popkin BM. Patterns and trends in food portion sizes, 1977–1998. JAMA. 2003;289(4):450–453. - PubMed
-
- Lin B, Frazao E, Guthrie J. Contribution of Away-From-Home Foods to American Diet Quality. Fam Econ Nutr Rev. 1999;12(3/4):85.
-
- Lin B-H, Frazao E, Guthrie J. Away-From-Home Foods Increasingly Important to Quality of American Diet. United States Department of Agriculture, Economic Research Service; 1999.
Publication types
MeSH terms
Grants and funding
LinkOut - more resources
Full Text Sources
