Comparative Study
. 2012 Feb;123(2):335-43.
doi: 10.1016/j.clinph.2011.06.031. Epub 2011 Jul 29.

Cortical and segmental excitability during fatiguing contractions of the soleus muscle in humans

Affiliations
Comparative Study

Cortical and segmental excitability during fatiguing contractions of the soleus muscle in humans

Masaki Iguchi et al. Clin Neurophysiol. 2012 Feb.

Abstract

Objective: The aim of this study was to examine the cortical and segmental excitability changes during fatigue of the soleus muscle.

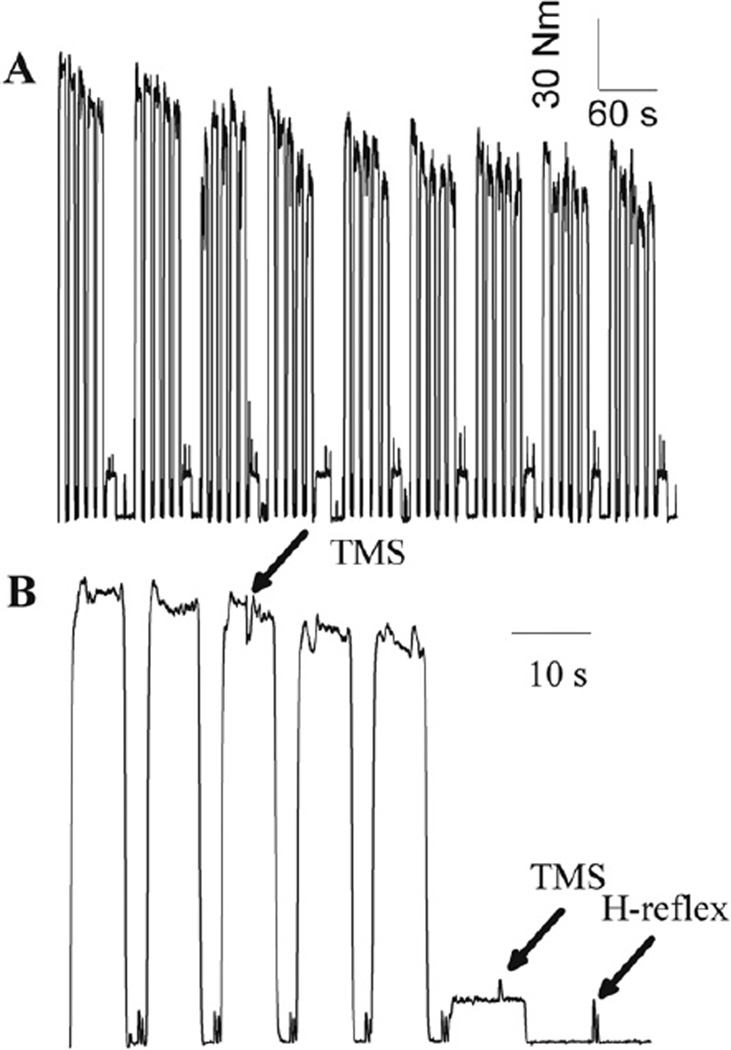
Methods: Ten healthy young subjects performed 45 plantar flexion maximal voluntary contractions (MVCs) (7-s on/3-s off) in 9 epochs of five contractions. Motor evoked potentials (MEPs) using transcranial magnetic stimulation and H-reflexes were assessed during the task.

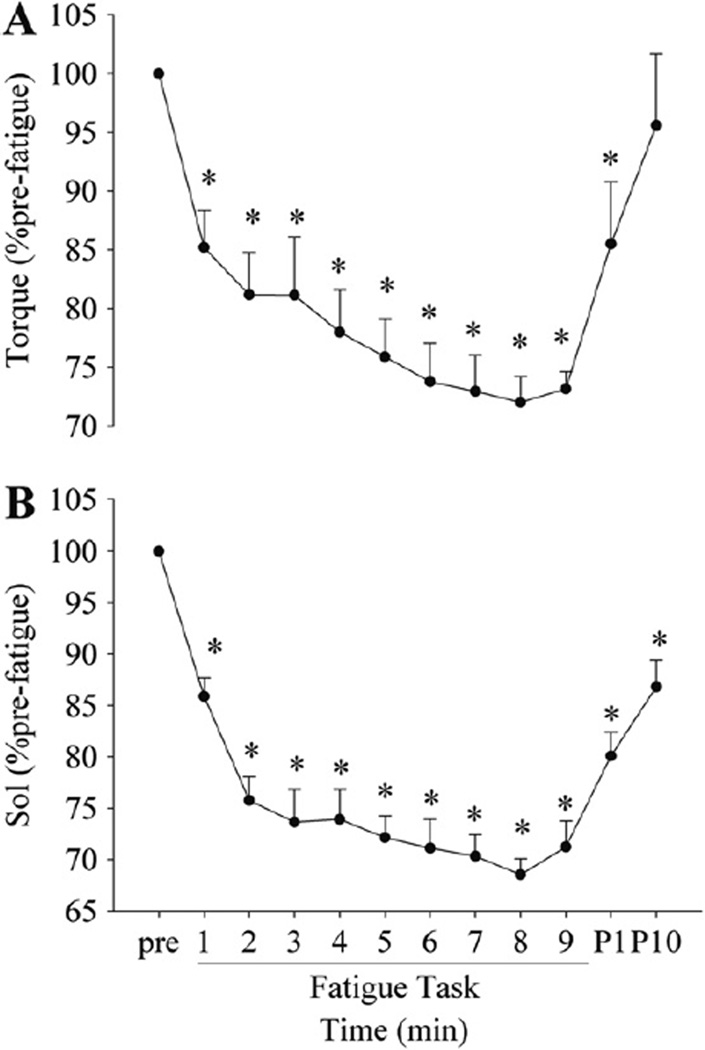
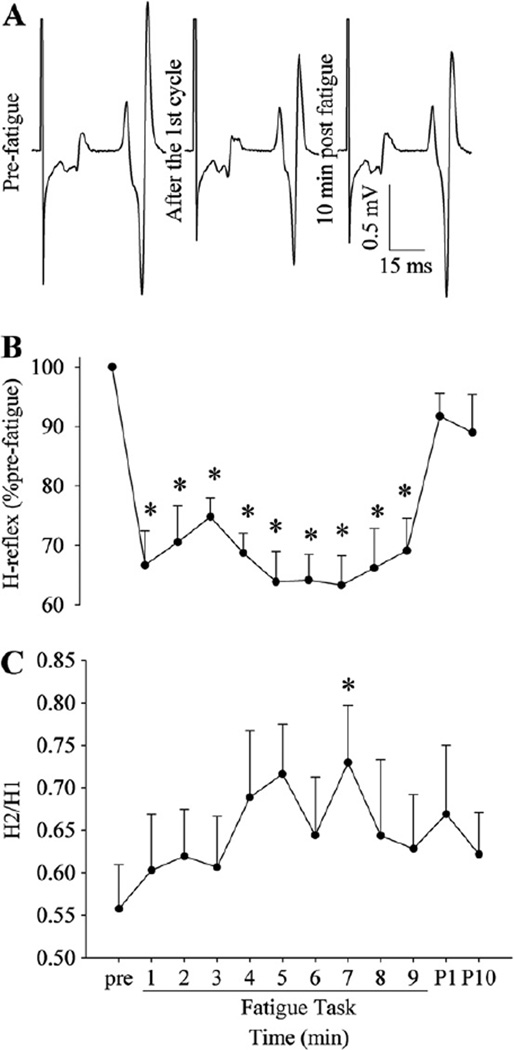
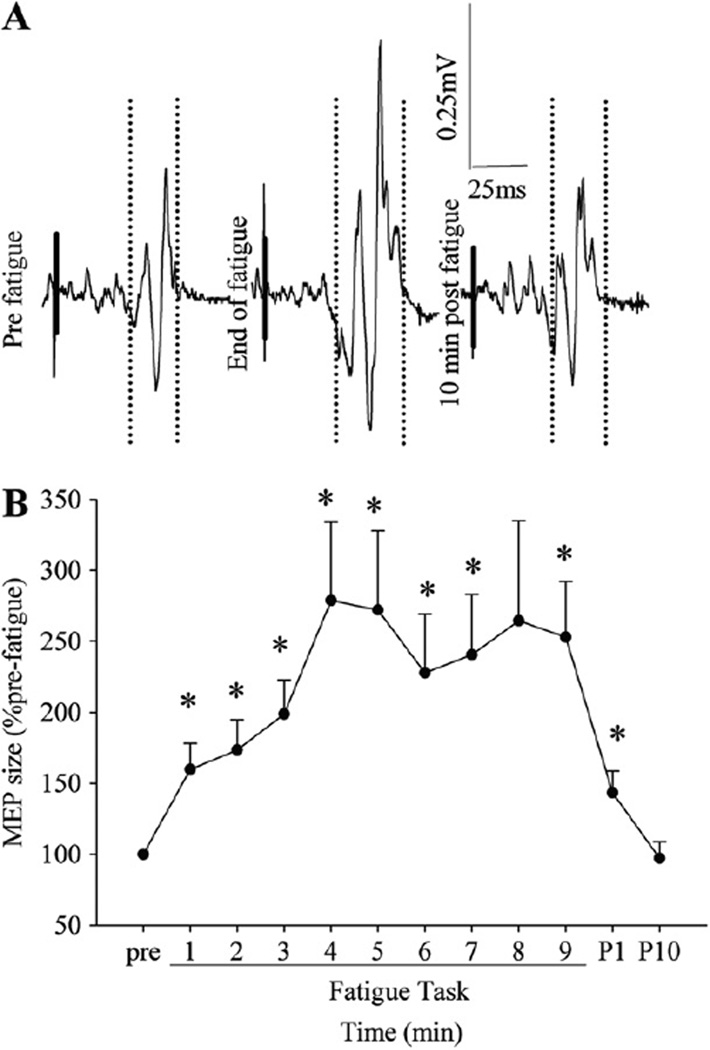
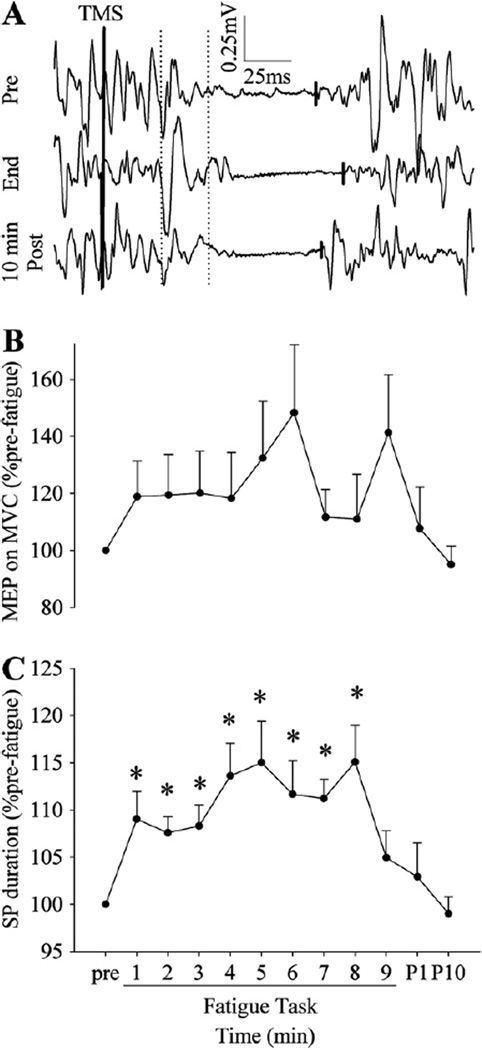
Results: The torque and the soleus EMG activity both showed the greatest decline during the 1st epoch, followed by a gradual, but significant decrease by the end of the task (∼70% pre-fatigue). The H-reflex sampled at rest after each epoch decreased to 66.6±18.3% pre-fatigue after the first epoch, and then showed no further change. The MEP on 10% pre-fatigue MVC after each epoch increased progressively (252.9±124.2% pre-fatigue). There was no change in the MEPs on the 3rd MVC in each epoch. The silent period on the MVC increased (109.0±9.2% pre-fatigue) early with no further changes during the task.

Conclusions: These findings support that the motor cortex increases excitability during fatigue, but with a concomitant inhibition.

Significance: These findings are in contrast to upper extremity muscles and may reflect a distinct response specific to postural, fatigue-resistant muscle.


Figures

Fig. 1
Fig. 1
A representative example of the volitional torque during the fatigue task (A) and an expanded signal showing only the first cycle (B). Subjects performed five 7-s MVCs and a 10-s target contraction at pre-fatigue 10% MVC, and then they were asked to relax for 15 s each cycle. The timings of TMS and electrical stimulation for the H-reflex are indicated by arrows in B. The small increases in torque before each MVC in B are due to electrical stimulation used to ensure that the size of the preceding small M waves is constant.
Fig. 2
Fig. 2
Changes in the voluntary torque (A) and voluntary Sol EMG activity (B) during and after the fatigue task. Pre, P1 and P10 indicate pre-fatigue, post 1- and 10-min fatigue task, respectively. The greatest decline in torque and EMG activity was found during the 1st cycle, followed by a more gradual, but significant decrease by the end of the task for both torque and EMG. *p < 0.05 from pre-fatigue values.
Fig. 3
Fig. 3
A representative example of the H-reflex (H1) (A) and changes in the size of H1 (B) and H2/H1 (C) during and after the fatigue task. The H-reflex size was decreased after the 1st cycle, and then showed no change toward the end of the task, whereas H2/H1 showed a trend of increasing with fatigue. *p < 0.05 from pre-fatigue values.
Fig. 4
Fig. 4
A representative example of the TMS responses (motor evoked potentials) recorded while a subject was holding a pre-fatigue 10% MVC target torque contraction (A) and changes in the MEP size (B) during and after the fatigue task. The vertical dotted lines in A indicate onsets and offsets of the time windows used to calculate the integrated amplitude of the MEP size, and short thick solid lines were superimposed on the stimulus artifacts on the EMG signal for clarity purpose. Fatigue increased the MEP size on the target contraction. *p < 0.05 from pre-fatigue values.
Fig. 5
Fig. 5
A representative example of the TMS responses recorded during MVCs (A) and changes in the MEP size (B) and SP duration (C) during and after the fatigue task. The vertical dotted lines indicate onsets and offsets of the time windows used to calculate the integrated amplitude of the MEP, and the short solid lines indicate the end of the SP. The MEP size on MVCs did not significantly change with fatigue, whereas the SP duration became longer during the 1st cycle, and then showed no change toward the end of the task. *p < 0.05 from pre-fatigue values.

References

    1. Amann M, Proctor LT, Sebranek JJ, Pegelow DF, Dempsey JA. Opioid-mediated muscle afferents inhibit central motor drive and limit peripheral muscle fatigue development in humans. J Physiol. 2009;587:271–283. - PMC - PubMed
    1. Bawa P, Chalmers GR, Stewart H, Eisen AA. Responses of ankle extensor and flexor motoneurons to transcranial magnetic stimulation. J Neurophysiol. 2002;88:124–132. - PubMed
    1. Benwell NM, Mastaglia FL, Thickbroom GW. Differential changes in long-interval intracortical inhibition and silent period duration during fatiguing hand exercise. Exp Brain Res. 2007;179:255–262. - PubMed
    1. Bigland-Ritchie B, Johansson R, Lippold OC, Woods JJ. Contractile speed and EMG changes during fatigue of sustained maximal voluntary contractions. J Neurophysiol. 1983;50:313–324. - PubMed
    1. Bongiovanni LG, Hagbarth KE. Tonic vibration reflexes elicited during fatigue from maximal voluntary contractions in man. J Physiol. 1990;423:1–14. - PMC - PubMed

Publication types