. 2011 Aug 3;14(2):196-207.
doi: 10.1016/j.cmet.2011.05.014.

Ryanodine receptor oxidation causes intracellular calcium leak and muscle weakness in aging

Affiliations

Ryanodine receptor oxidation causes intracellular calcium leak and muscle weakness in aging

Daniel C Andersson et al. Cell Metab. .

Abstract

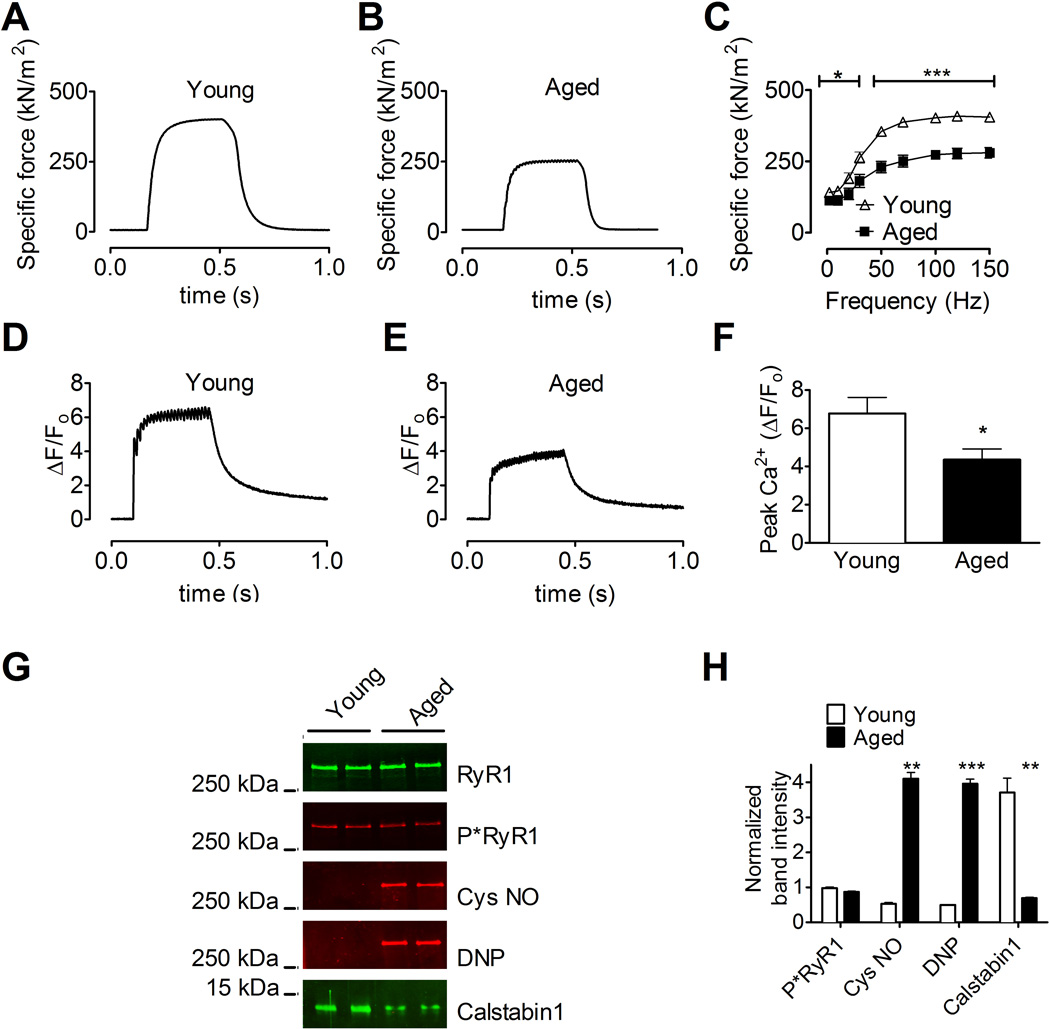
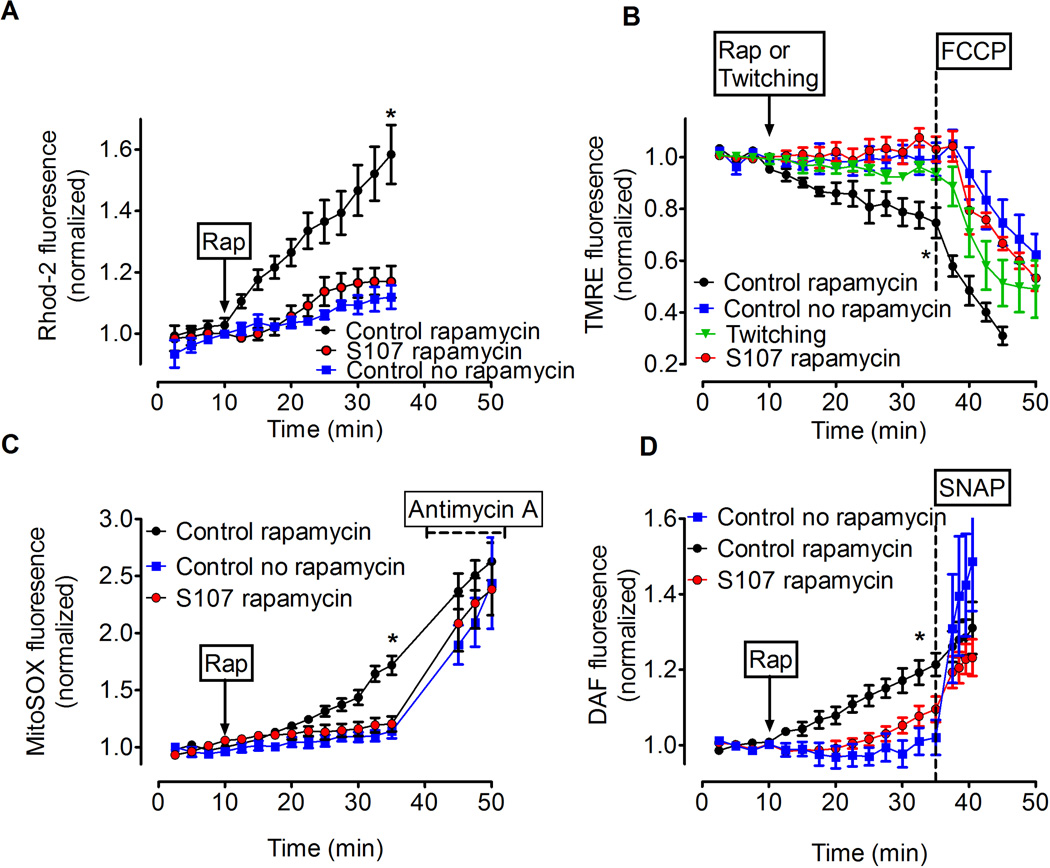
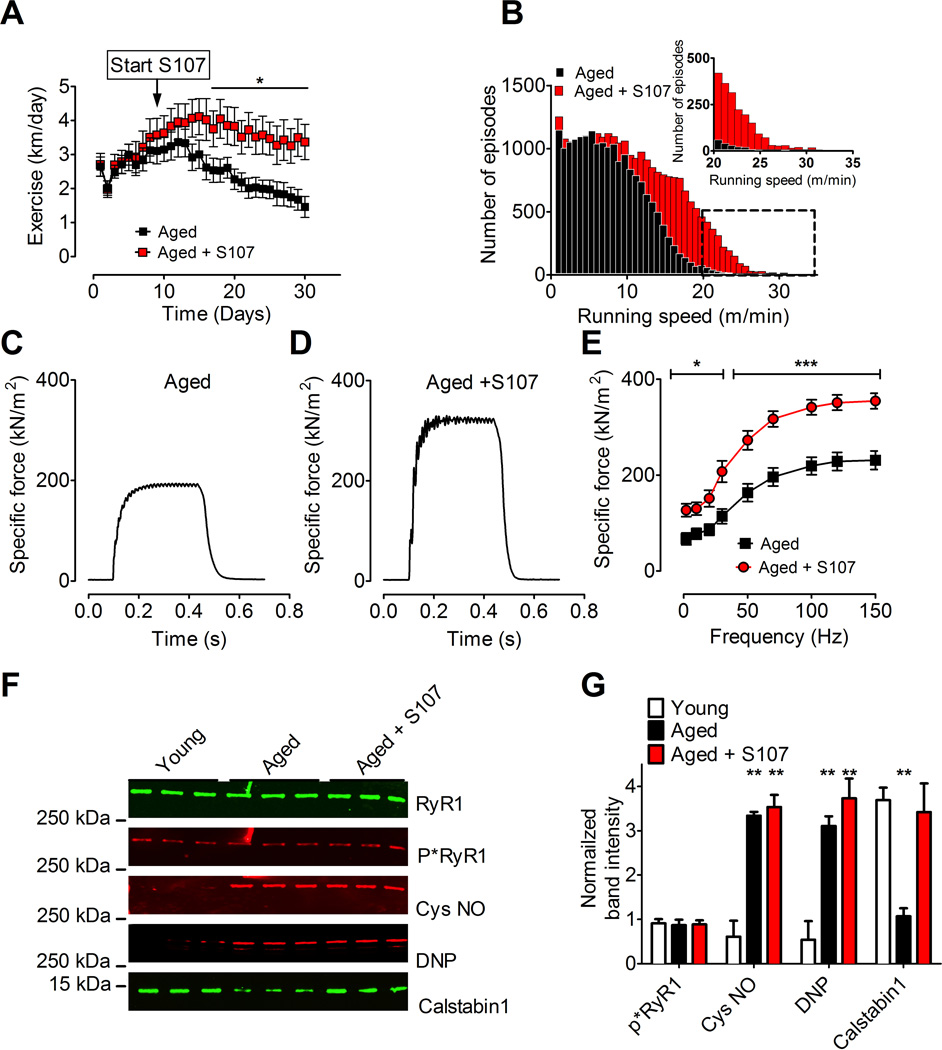
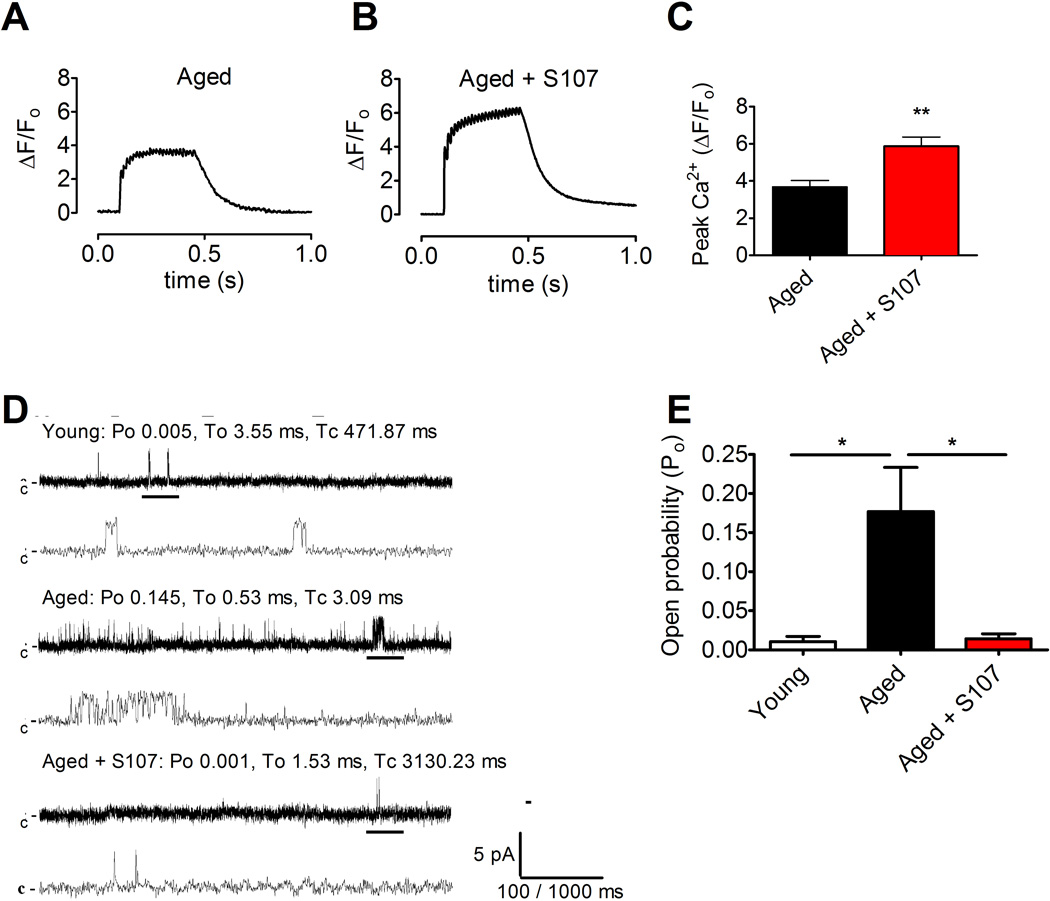
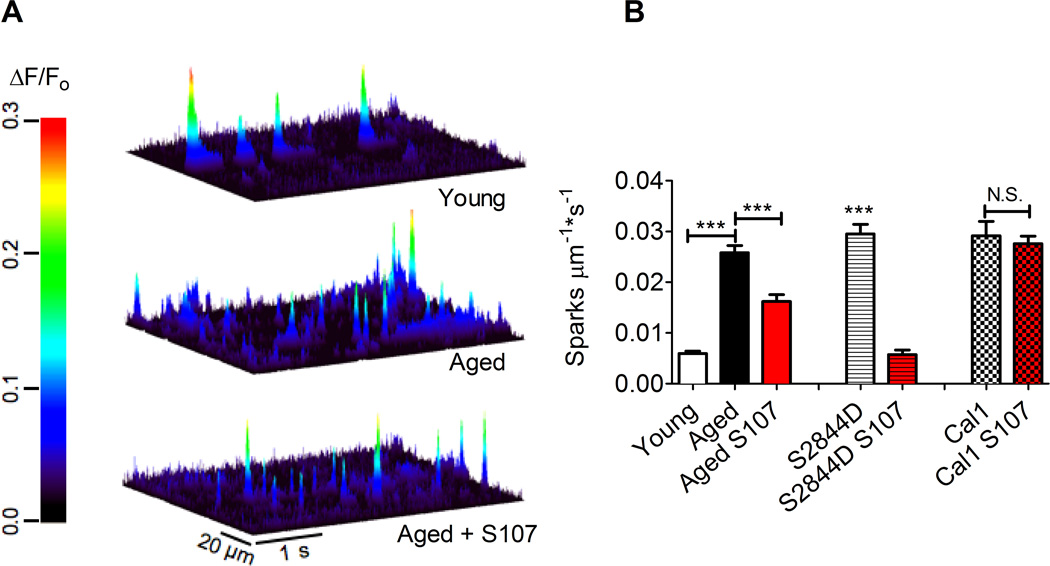
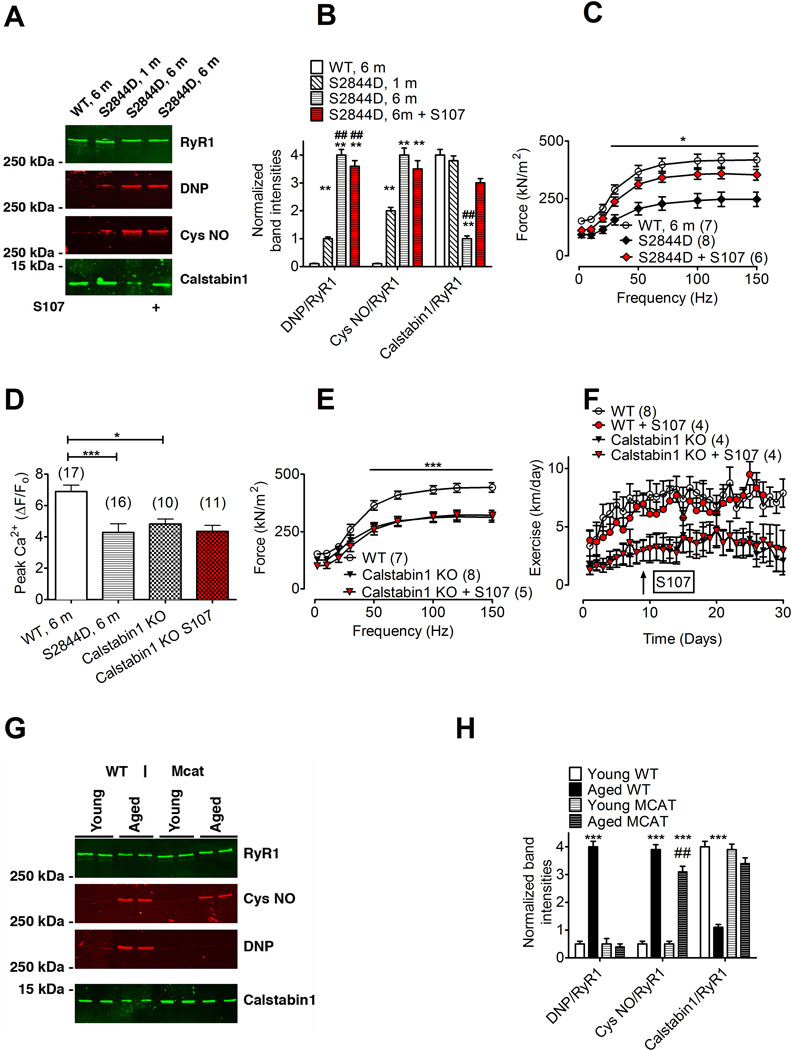
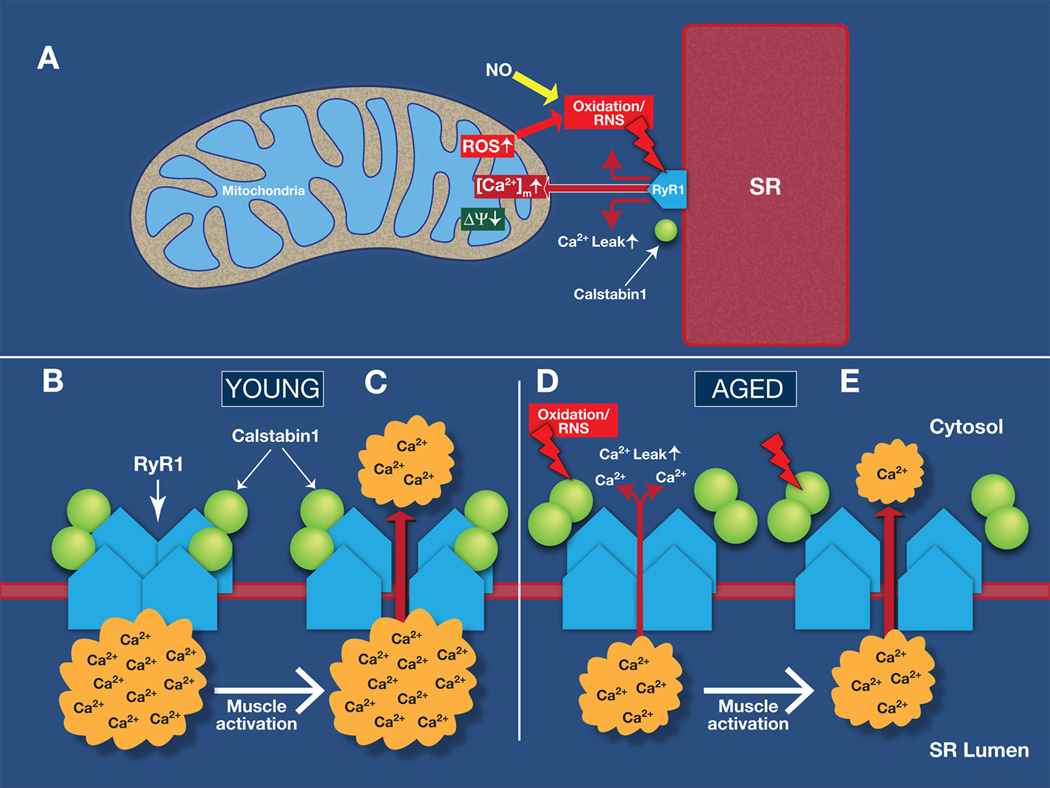
Age-related loss of muscle mass and force (sarcopenia) contributes to disability and increased mortality. Ryanodine receptor 1 (RyR1) is the skeletal muscle sarcoplasmic reticulum calcium release channel required for muscle contraction. RyR1 from aged (24 months) rodents was oxidized, cysteine-nitrosylated, and depleted of the channel-stabilizing subunit calstabin1, compared to RyR1 from younger (3-6 months) adults. This RyR1 channel complex remodeling resulted in "leaky" channels with increased open probability, leading to intracellular calcium leak in skeletal muscle. Similarly, 6-month-old mice harboring leaky RyR1-S2844D mutant channels exhibited skeletal muscle defects comparable to 24-month-old wild-type mice. Treating aged mice with S107 stabilized binding of calstabin1 to RyR1, reduced intracellular calcium leak, decreased reactive oxygen species (ROS), and enhanced tetanic Ca(2+) release, muscle-specific force, and exercise capacity. Taken together, these data indicate that leaky RyR1 contributes to age-related loss of muscle function.


Conflict of interest statement

Conflict of interest: A.R. Marks is a consultant for a start-up company, ARMGO Pharma Inc., that is targeting RyR1 to improve exercise capacity in muscle diseases

Figures

Figure 1
Figure 1. Impaired force production and reduced SR Ca2+ release in EDL muscle from aged mice
(A and B) Tetanic contractions of EDL muscle from young (A) and aged (B) mice (force normalized to cross-sectional area). (C) Average force at the indicated stimulation frequencies in EDL muscles from young and aged mice (mean, ± SEM, n = 5 (young), 7 (aged), P < 0.05 among groups at all stimulation frequencies). (D and E) Normalized fluo-4 fluorescence in FDB muscle fibers during a 70 Hz tetanic stimulation. (F) Peak Ca2+ responses in FDB fibers stimulated at 70 Hz (fibers taken from the same animals as in A and B; mean, ± SEM, n = 8 (young), 10 (aged), * P < 0.05). (G) Immunoblots of immunoprecipitated RyR1 from young and aged mice. (H) Bar graphs show quantification of the immunoblots in G (mean, ± SEM, n = 2, ** P < 0.01, ***P < 0.001). DNP: 2,4- dinitrophenylhydrazone. P*RyR1: Phosphorylated RyR1 (at serine 2844). See also Figure S1 and 2A.
Figure 2
Figure 2. Effects of SR Ca2+ leak on mitochondrial membrane potential, ROS and RNS production in skeletal muscle fibers
(A) Rapamycin-induced increase in mitochondrial Ca2+ measured with the fluorescent indicator Rhod-2. The Rhod-2 signal was measured from three mitochondria rich regions in each cell (mitochondria rich regions were confirmed using mitotracker green, see Fig. S4) and normalized to baseline; * P < 0.05 indicates significant difference of the control rapamycin (N = 7) compared to S107 (N = 6) and control no rapamycin (N = 4) groups (ANOVA). In the S107 rapamycin group FDB fibers were incubated with S107 (5 µM) for 2–4 hrs before starting the experiment. (B) Changes in mitochondrial membrane potential (measured with TMRE fluorescence) with respect to different interventions. Arrow indicates onset of rapamycin (for groups control rapamycin and S107 rapamycin) or repetitive twitch stimulation without rapamycin (twitching). The dashed line indicates application of FCCP (300 nM). * P < 0.05 indicates significant difference (ANOVA) among the groups control rapamycin (n = 5) and control no rapamycin (n = 3) or group twitching (n = 6) or S107 rapamycin (n = 5). (C) Mitochondrial superoxide production in FDB fibers measured with MitoSOX Red. Arrow indicates when rapamycin was applied. The dashed line indicates application of Antimycin A (10 µM) as a positive control for superoxide production. Control rapamycin (n = 8), Control no rapamycin (n = 5), S107 rapamycin (n = 5). * P < 0.05 indicates significant difference between the control rapamycin group and no rapamycin or S107 groups (ANOVA). (D) The effect of rapamycin-induced Ca2+ leak on RNS production in FDB fibers measured with the RNS indicator DAF. Arrow indicates application of rapamycin. The NO donor S-nitroso-N-acetylpenicillamine (SNAP; 100 nM) was applied as a positive control at the end of each experiment (indicated by dashed line). Control rapamycin (n = 6), control no rapamycin (n = 6), S107 rapamycin (n = 5). * P < 0.05 indicates significant difference (ANOVA) for the control rapamycin group compared to the S107 and no rapamycin groups. All data are shown as mean ± SEM. See also Figure S4.
Figure 3
Figure 3. Improved exercise capacity, muscle specific force, and increased calstabin1 in the RyR1 complex following S107 treatment of aged mice
(A) Daily voluntary running distance in aged mice ± S107 treatment (mean, ± SEM, n = 13 aged + S107, n = 14 aged, * P < 0.05, ANOVA). The arrow indicates start of the S107 treatment. (B) Histogram showing the distribution of the number of 5-minute episodes in which the mice ran at a given speed. The insert shows the tail of the histogram at expanded time scale. Note the increased number of high-speed episodes in S107 treated mice compared to control. (C and D) 70 Hz tetanic contractions in isolated EDL muscles from aged and S107 treated aged mice. (E) Average specific force in EDL muscles from the same mice as in A (mean ±SEM, n = 6 young, 7 aged, * P < 0.05, *** P < 0.001). (F) Immunoblot of immunoprecipitated RyR1 from aged murine skeletal muscle (aged EDL muscles taken from the mice in A and E). (G) Quantification of the immunoblot in F. S107 reduced depletion of calstabin1 from the RyR1 complex in skeletal muscle from aged mice (mean, ±SEM, n=3, ** P < 0.01, compared to young). See also Figure S1 and S2.
Figure 4
Figure 4. S107 reduces SR Ca2+ leak resulting in enhanced tetanic SR Ca2+ release in skeletal muscle from aged mice
(A and B) Ca2+ transients Fluo-4 fluorescence in FDB muscle fibers during a 70 Hz tetanic stimulation in control mice (A) and mice treated with S107 (B). (C) Peak tetanic Ca2+ amplitudes in the two treatment groups (muscle fibers were taken from the same animals as in Figure 3A-B; mean, ±SEM, n = 10–13, ** P < 0.01). (D) Single channel current traces of skeletal RyR1 channels isolated from young, aged, and aged + S107 treated mice. Single channel currents were measured at 150 nM cytosolic [Ca2+] using Ca2+ as a charge carrier at 0 mV. Channel openings are shown as upward deflections; the closed (c-) state of the channel is indicated by horizontal bars in the beginning of each trace. Tracings from over three minutes of recording for each condition showing channel activity at two time scales (5 s in upper trace and 500 ms in lower trace) as indicated by dimension bars, and the respective Po, To (average open time) and Tc (average closed time) are shown above each 5 s trace. The activity of the channel indicated by the thick black bar is shown on the expanded time scale (the 500 ms trace below). (E) Bar graph summarizing Po at 150 nM cytosolic [Ca2+] in young n = 4, aged n = 5, and aged + S107 treated n = 5 channels (mean, ± SEM, * P < 0.05 (ANOVA)).
Figure 5
Figure 5. Elevated Ca2+ spark frequency is reversed by S107 in EDL muscle from aged WT mice and RyR1-S2844D mice but not in calstabin1 KO mice
(A) Line scans of Fluo-4 fluorescence from permeablized EDL muscle fibers (young: upper panel; aged: middle panel; aged +S107: lower panel) showing Ca2+ spark activity. The heat diagram indicates the normalized change in fluorescence intensity (ΔF/F0). (B) Bar graph showing average Ca2+ spark frequency (the number of sparks examined were: 1219 in the young mice, n = 530 line scans from 32 fibers and 6 animals; 7389 in the vehicle-treated aged mice, n = 505 line scans from 30 fibers and 6 animals; 3713 in aged mice treated with S107, n = 414 line scans from 25 fibers and 5 animals; 673 in the untreated RyR1-S2844D mice, n = 240 line scans from 15 fibers and 3 animals; 2405 in S107 treated RyR1-S2844D mice, n = 210 line scans from 14 cells and 3 animals; mean, ± SEM, *** P < 0.001 (ANOVA).
Figure 6
Figure 6. Improved muscle function and exercise capacity in S107 treated mice requires calstabin1
(A) Immunoblot of immunoprecipitated RyR1 from WT, 1 month old (1 m), 6 month old (6 m) RyR1-S2844D mice and 6 month old (6 m) RyR1-S2844D mice that was treated with S107 (from the same animals as in (C)). (B) Quantification of band intensities in A (mean ± SEM, n = 3, ** P < 0.01 compared to WT, ## P < 0.01 compared to S2844D 1 m, ANOVA). RyR1 from RyR1-S2844D mice are progressively oxidized (DNP) and depleted of calstabin1 with age. (C) EDL muscle force-frequency curves in 6 month old RyR1-S2844D mice and young WT mice. S107 treatment (4 weeks) significantly increased muscle force in the RyR1-S2844D mice (mean ± SEM). (D) Peak Ca2+ transient amplitudes at 70 Hz tetanic stimulation [peak Fluo-4 fluorescence (F) was normalized to resting fluorescence (F0), ΔF/F0]. (E) EDL muscle from muscle-specific calstabin1 KO mice produce significantly less force compared to young WT. S107 treatment (4 weeks) did not restore EDL muscle force in muscle-specific calstabin1 KO mice. (F) Daily voluntary running distance in young WT mice ± S107 treatment and in muscle-specific calstabin1 KO mice ± S107 treatment (mean, ± SEM; * P < 0.05 (ANOVA). The arrow indicates start of the S107 treatment. (G) Immunoblot of immunoprecipitated muscle RyR1 from young WT, aged (18 month) WT, young transgenic mice with mitochondrial targeted overexpression of catalase (MCAT) and aged (18 month) MCAT mice. (H) Quantification of band intensities in G (mean ± SEM, n = 4 all groups; *** P < 0.001, ## P < 0.01 compared to aged WT (ANOVA). The pooled data in the figure are mean ± SEM; * P < 0.05, *** P < 0.001 (ANOVA); the number of samples are indicated in parentheses in the figure legend. See also Figure S2.
Figure 7
Figure 7. Model of RyR1-mediated SR Ca2+ leak and mitochondrial dysfunction in aging skeletal muscle
(A) Sarcoplasmic reticulum (SR) Ca2+ leak due to oxidation-dependent modifications of RyR1 exacerbates mitochondrial dysfunction and production of reactive oxygen species (ROS). This causes remodeling of RyR1 resulting in SR Ca2+ leak, which impairs muscle force production. (B-C) The RyR1 from young mice are not “leaky”, the SR Ca2+ stores are filled and activation of the myocyte leads to SR Ca2+ release which triggers muscle contraction. (D-E) In aging, ROS and reactive nitrogen species (RNS)–mediated remodeling of RyR1 results in dossociation of the RyR1 stabilizing subunit calstabin1 and SR Ca2+ leak. Under these conditions, muscle activation will lead to reduced SR Ca2+ release and impaired muscle force. Ryanodine receptor type 1: RyR1 Reactive oxygen species: ROS. Sarcoplasmic reticulum: SR. Mitochondrial [Ca2+]: [Ca2+]m. Mitochondrial membrane potential: Δψm.

References

    1. Ahern GP, Junankar PR, Dulhunty AF. Subconductance states in single-channel activity of skeletal muscle ryanodine receptors after removal of FKBP12. Biophys J. 1997;72:146–162. - PMC - PubMed
    1. Allen DG, Lamb GD, Westerblad H. Skeletal muscle fatigue: cellular mechanisms. Physiological Reviews. 2008;88:287–332. - PubMed
    1. Andersson DC, Marks AR. Fixing ryanodine receptor Ca leak - a novel therapeutic strategy for contractile failure in heart and skeletal muscle. Drug Discov Today Dis Mech. 2010;7:e151–e157. - PMC - PubMed
    1. Aracena-Parks P, Goonasekera SA, Gilman CP, Dirksen RT, Hidalgo C, Hamilton SL. Identification of cysteines involved in S-nitrosylation, S-glutathionylation, and oxidation to disulfides in ryanodine receptor type 1. J Biol Chem. 2006;281:40354–40368. - PubMed
    1. Aydin J, Andersson DC, Hanninen SL, Wredenberg A, Tavi P, Park CB, Larsson NG, Bruton JD, Westerblad H. Increased mitochondrial Ca2+ and decreased sarcoplasmic reticulum Ca2+ in mitochondrial myopathy. Human Molecular Genetics. 2009;18:278–288. - PubMed

Publication types

MeSH terms