. 2011 Aug 3;14(2):264-71.
doi: 10.1016/j.cmet.2011.06.011.

Somatic oxidative bioenergetics transitions into pluripotency-dependent glycolysis to facilitate nuclear reprogramming

Affiliations

Somatic oxidative bioenergetics transitions into pluripotency-dependent glycolysis to facilitate nuclear reprogramming

Clifford D L Folmes et al. Cell Metab. .

Abstract

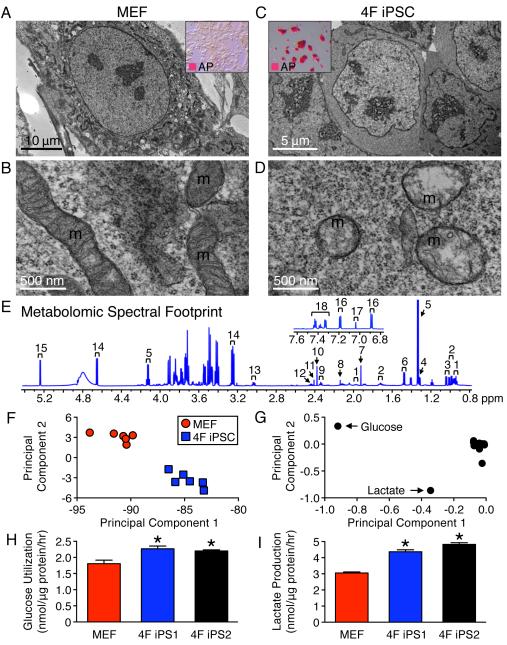
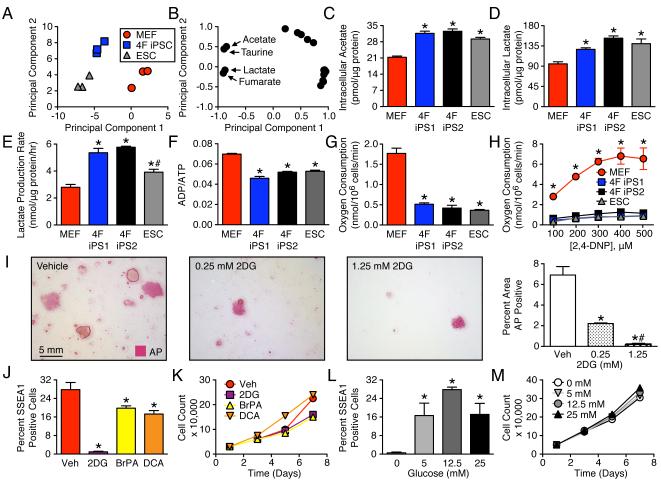
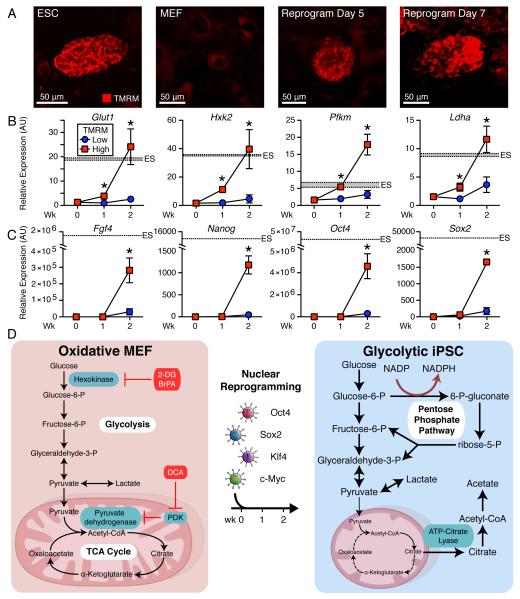
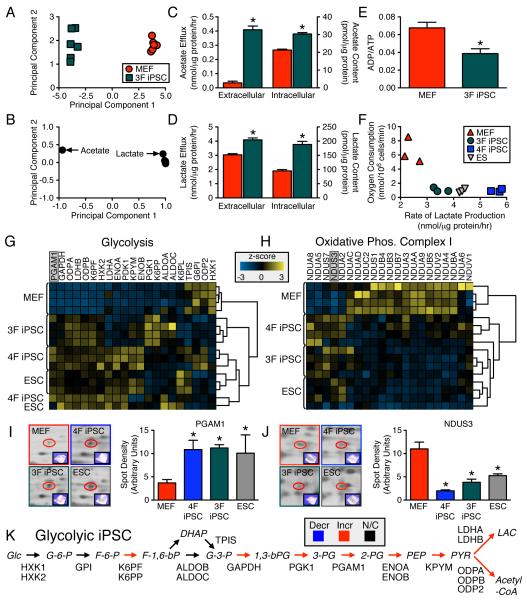
The bioenergetics of somatic dedifferentiation into induced pluripotent stem cells remains largely unknown. Here, stemness factor-mediated nuclear reprogramming reverted mitochondrial networks into cristae-poor structures. Metabolomic footprinting and fingerprinting distinguished derived pluripotent progeny from parental fibroblasts according to elevated glucose utilization and production of glycolytic end products. Temporal sampling demonstrated glycolytic gene potentiation prior to induction of pluripotent markers. Functional metamorphosis of somatic oxidative phosphorylation into acquired pluripotent glycolytic metabolism conformed to an embryonic-like archetype. Stimulation of glycolysis promoted, while blockade of glycolytic enzyme activity blunted, reprogramming efficiency. Metaboproteomics resolved upregulated glycolytic enzymes and downregulated electron transport chain complex I subunits underlying cell fate determination. Thus, the energetic infrastructure of somatic cells transitions into a required glycolytic metabotype to fuel induction of pluripotency.


Figures

Figure 1
Figure 1. Nuclear reprogramming transforms mitochondrial structure inducing a distinct metabolomic footprint
Nuclear reprogramming induced regression from elongated and cristae-rich mitochondria (m) of MEF (A, B) to spherical and cristae-poor remnant structures in four stemness factor derived iPSC (4F iPSC) (D). Insets demonstrate conversion of fibroblast monolayers (A) into compact clusters (C), which stained for the pluripotency marker AP. 1H NMR spectra of extracellular metabolites from 4F iPSC: 1 – isoleucine, 2 – leucine, 3 – valine, 4 – threonine, 5 – lactate, 6 – alanine, 7 – acetate, 8 – methionine, 9 – glutamate, 10 – pyruvate, 11 – succinate, 12 – glutamine, 13 – lysine, 14 – β-glucose, 15 – α-glucose, 16 – tyrosine, 17 – histidine and 18 – phenylalanine (E). Principal component analysis segregated 4F iPSC metabolomic phenotypes away from the MEF profile with principal component 1 accounting for 88% and 2 for 8% of the total variance (F). The loading plot assigned glucose and lactate as key metabolites contributing to segregation (G). Increased utilization of glucose and production of glycolytic end products in excess of MEF (H, I) were reproduced in independent iPSC lines (4F iPS1 and 4F iPS2). Values are mean ± SEM, n=6. * P<0.05 versus MEF. See also Figure S1.
Figure 2
Figure 2. Induction of pluripotency requires functional glycolysis
1H NMR fingerprinting of intracellular metabolites segregated 4F iPSC away from MEF and towards ESC (A). First principal component accounts for 67% and the second for 25% of the total variance. Acetate, taurine, lactate, and fumarate were identified as differentiating metabolites (B). Intracellular concentrations of glycolytic end products were distinct in 4F iPSC compared to MEF, and were similar to ESC patterns (C, D). Nuclear reprogramming elevated lactate efflux rates (E) and reduced energy turnover in 4F iPSC, similar to that of ESC (F). Compared to MEF, iPSC and ESC had reduced basal oxygen consumption (G) and lower maximal uncoupled oxidative capacity (H). During reprogramming the glycolytic inhibitor, 2-deoxyglucose (2DG), blunted induction of the pluripotency marker alkaline phosphatase (I). Glycolytic inhibitors, 1.25 mM 2DG and 100 μM 3-bromopyruvic acid (BrPA) and alternatively a stimulator of oxidative pyruvate disposal, 5 mM dichloroacetate (DCA), reduced reprogramming efficiency, assessed by SSEA1 FACS analysis (J), without altering the growth pattern of MEF (K). Stimulation of glycolysis by elevating extracellular glucose promoted the number of cells achieving the reprogrammed state (L) without altering growth of the parental population (M). Values are mean ± SEM, n=3 except for lactate efflux where n=6. In all panels except H, *P<0.05 versus MEFs and #P<0.05 versus 4F iPSC. In H, *P<0.05 versus 4F iPS and ESC. See also Figure S2.
Figure 3
Figure 3. Glycolytic engagement mobilizes pluripotent gene induction
Similar to ESC and distinct from MEF, live cell imaging of mitochondrial membrane potential identified nascent compact cell clusters with high TMRM fluorescence within 5-7 days of nuclear reprogramming (A). Compared to the low TMRM fluorescence population, high fluorescence cells had significantly elevated glycolytic gene expression (Glut1, Hxk2, Pfkm and Ldha) within 1-week of reprogramming, which by 2-weeks of reprogramming equaled ESC glycolytic gene expression (B). Of note, at week one of reprogramming pluripotent gene expression (Fgf4, Nanog, Oct4 and Sox2) remained low in high TMRM fluorescence cells, similar to the starting MEF, with pluripotent gene induction apparent during the second week (C). Shaded region represents mean ± SEM for ESC gene expression. Values are mean ± SEM, n=3. * P<0.05 versus low TMRM population. Nuclear reprogramming switches oxidative MEF into glycolytic iPSC (D). See also Figure S3.
Figure 4
Figure 4. Metabolic reprogramming is independent of c-Myc transduction and supported by glycolytic/electron transport chain proteome switch
1H NMR cellular metabolomic fingerprints (n=6) of three stemness factor induced iPSC (3F iPSC) segregated, away from the somatic, the acquired pattern (first principal component accounts for 97% and second for 1% of total variance) (A). Glycolytic end products, acetate and lactate, were key metabolites responsible for segregation (B). Intracellular content and efflux of acetate and lactate were significantly elevated in the 3F iPSC compared to MEF (C and D) and associated with reduced energy turnover (n=6) (E). Compared to MEF, 3F iPSC had lower maximal oxidative capacity and higher lactate production similar to that of ESC, albeit not fully overlapping with 4F iPSC (n=3) (F). Proteome-wide label-free quantification segregated iPSC away from MEF towards an ESC pattern based on agglomerative clustering of z-score transformed data (n=4) due to predominant glycolytic enzyme upregulation (G). Electron transport chain complex I subunits were predominantly downregulated in pluripotent cytotypes, which clustered away from MEF (H). 2-D gel quantification and MS/MS identification (n=3) independently confirmed glycolytic upregulation (I) and complex I downregulation (J). iPSC proteomic upregulation was mapped across the glycolytic pathway (K). Values are mean ± SEM. *P<0.05 versus MEF. Proteins are abbreviated by Swiss-Prot gene name. See also Figure S4 and Tables S1 and S2.

Comment in

  • Anaerobicizing into pluripotency.
    Panopoulos AD, Izpisua Belmonte JC. Panopoulos AD, et al. Cell Metab. 2011 Aug 3;14(2):143-4. doi: 10.1016/j.cmet.2011.07.003. Cell Metab. 2011. PMID: 21803281

References

    1. Armstrong L, Tilgner K, Saretzki G, Atkinson SP, Stojkovic M, Moreno R, Przyborski S, Lako M. Human induced pluripotent stem cell lines show similar stress defence mechanisms and mitochondrial regulation to human embryonic stem cells. Stem Cells. 2010;28:661–673. - PubMed
    1. Beckonert O, Keun HC, Ebbels TM, Bundy J, Holmes E, Lindon JC, Nicholson JK. Metabolic profiling, metabolomic and metabonomic procedures for NMR spectroscopy of urine, plasma, serum and tissue extracts. Nat Protoc. 2007;2:2692–2703. - PubMed
    1. Bock C, Kiskinis E, Verstappen G, Gu H, Boulting G, Smith ZD, Ziller M, Croft GF, Amoroso MW, Oakley DH, et al. Reference Maps of human ES and iPS cell variation enable high-throughput characterization of pluripotent cell lines. Cell. 2011;144:439–452. - PMC - PubMed
    1. Cho YM, Kwon S, Pak YK, Seol HW, Choi YM, Park do J, Park KS, Lee HK. Dynamic changes in mitochondrial biogenesis and antioxidant enzymes during the spontaneous differentiation of human embryonic stem cells. Biochem. Biophys. Res. Commun. 2006;348:1472–1478. - PubMed
    1. Chung S, Arrell DK, Faustino RS, Terzic A, Dzeja PP. Glycolytic network restructuring integral to the energetics of embryonic stem cell cardiac differentiation. J. Mol. Cell. Cardiol. 2010;48:725–734. - PMC - PubMed

Publication types

LinkOut - more resources