

Modeling regional vulnerability to Alzheimer pathology
- PMID: 21803455
- PMCID: PMC4459133
- DOI: 10.1016/j.neurobiolaging.2011.05.028
Modeling regional vulnerability to Alzheimer pathology
Abstract
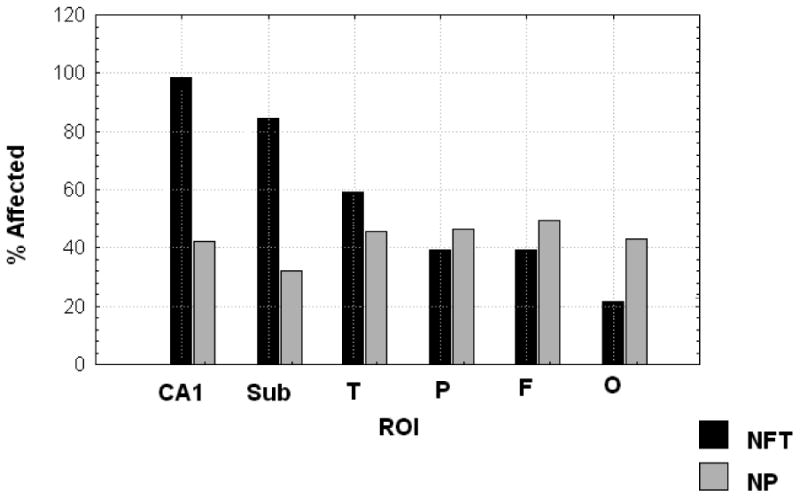
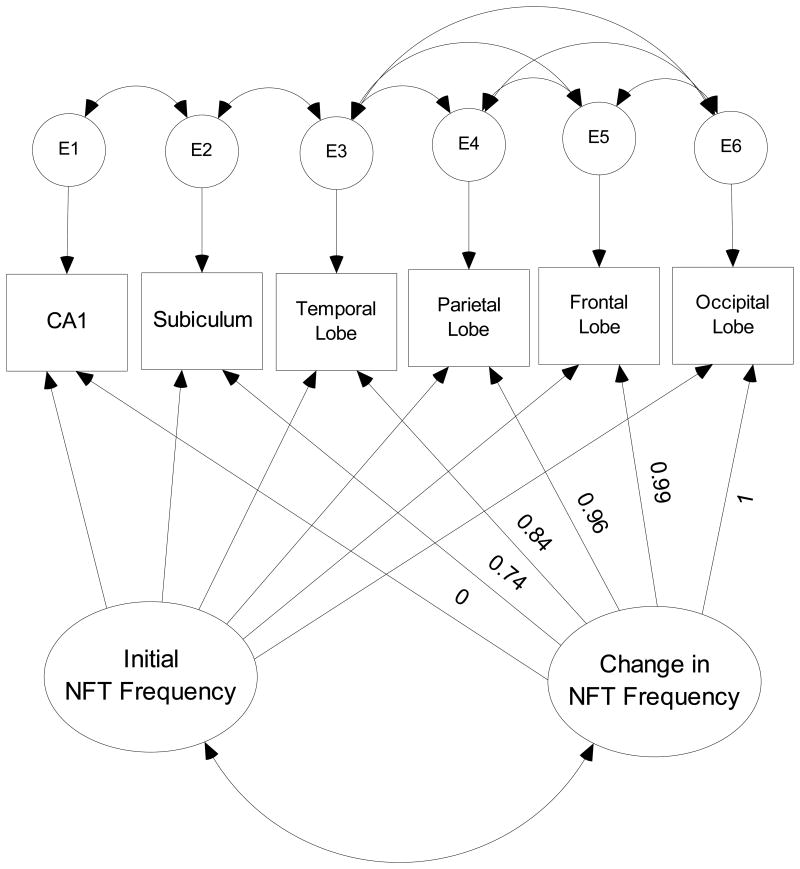
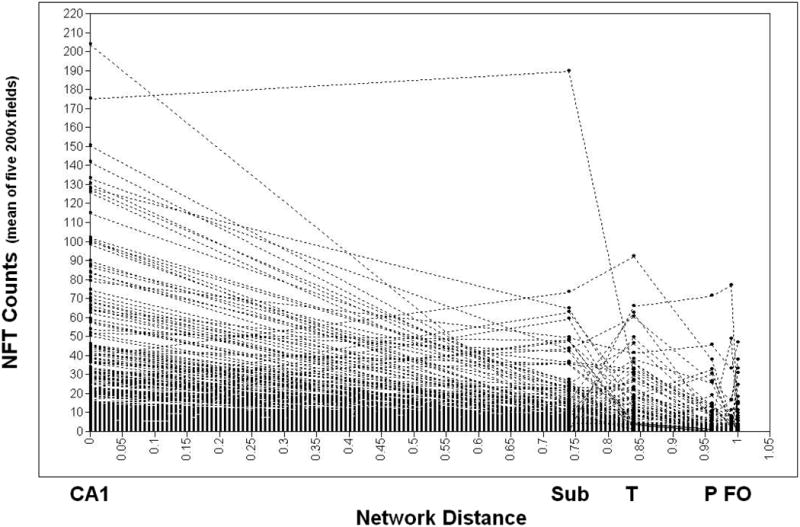
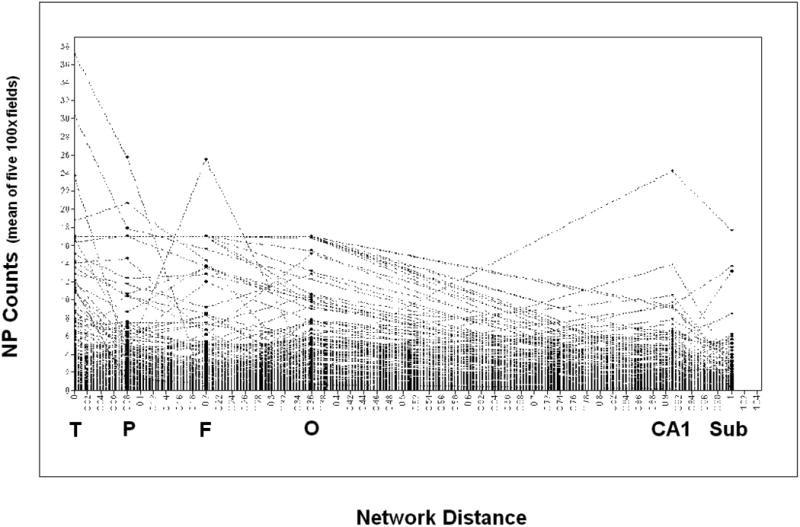
Latent growth curve (LGC) models estimate change over time in a cohort's serially obtained measurements. We have applied LGC techniques to a spatial distribution of Alzheimer's disease (AD) pathology using autopsy data from 435 participants in the Honolulu-Asia Aging Study. Neurofibrillary tangle (NFT) and neuritic plaques (NP) were distributed across differently ordered sets of anatomical regions. The gradient of spatial change in neuritic plaque (dNP), was significantly associated with that of neurofibrillary tangle (dNFT), but weakly and inversely (r = -0.12; p < 0.001). Both dNFT and dNP correlated significantly and inversely with Braak stage. Sixty-one percent of the variance in Braak stage was explained by dNFT independent of covariates. Only dNFT was significantly associated with longitudinal change in cognition. Only dNP was associated with apolipoprotein (APOE) e4 burden. This is the first application of LGC models to spatially-ordered data. The result is a quantification of the interindividual variation in the interregional vulnerability to Alzheimer's disease lesions.
Copyright © 2012. Published by Elsevier Inc.
Conflict of interest statement
Figures
References
-
- Armstrong RA, Cairns NJ, Lantos PL. What does the study of the spatial patterns of pathological lesions tell us about the pathogenesis of neurodegenerative disorders? Neuropathology. 2001;21:1–12. - PubMed
-
- Armstrong RA, Myers D, Smith CU. The spatial patterns of plaques and tangles in Alzheimer's disease do not support the ‘cascade hypothesis’. Dementia. 1993;3(4):16–20. - PubMed
-
- Arnold SE, Hyman BT, Flory J, Damasio AR, Van Hoesen GW. The topographical and neuroanatomical distribution of neurofibrillary tangles and neuritic plaques in the cerebral cortex of patients with Alzheimer's disease. Cereb Cortex. 1991;1:103–116. - PubMed
-
- Arriagada PV, Growdon JH, Hedley-Whyte ET, Hyman BT. Neurofibrillary tangles but not amyloid plaques parallel duration and severity of Alzheimer's disease. Neurology. 1992;42:631–639. - PubMed
-
- Bennett DA, Schneider JA, Wilson RS, Bienias JL, Arnold SE. Neurofibrillary tangles mediate the association of amyloid load with clinical Alzheimer disease and level of cognitive function. Arch Neurol. 2004;61:378–84. - PubMed
Publication types
MeSH terms
Grants and funding
LinkOut - more resources
Full Text Sources
Medical
Miscellaneous
