

Physiological parameter monitoring from optical recordings with a mobile phone
- PMID: 21803676
- PMCID: PMC3476722
- DOI: 10.1109/TBME.2011.2163157
Physiological parameter monitoring from optical recordings with a mobile phone
Abstract
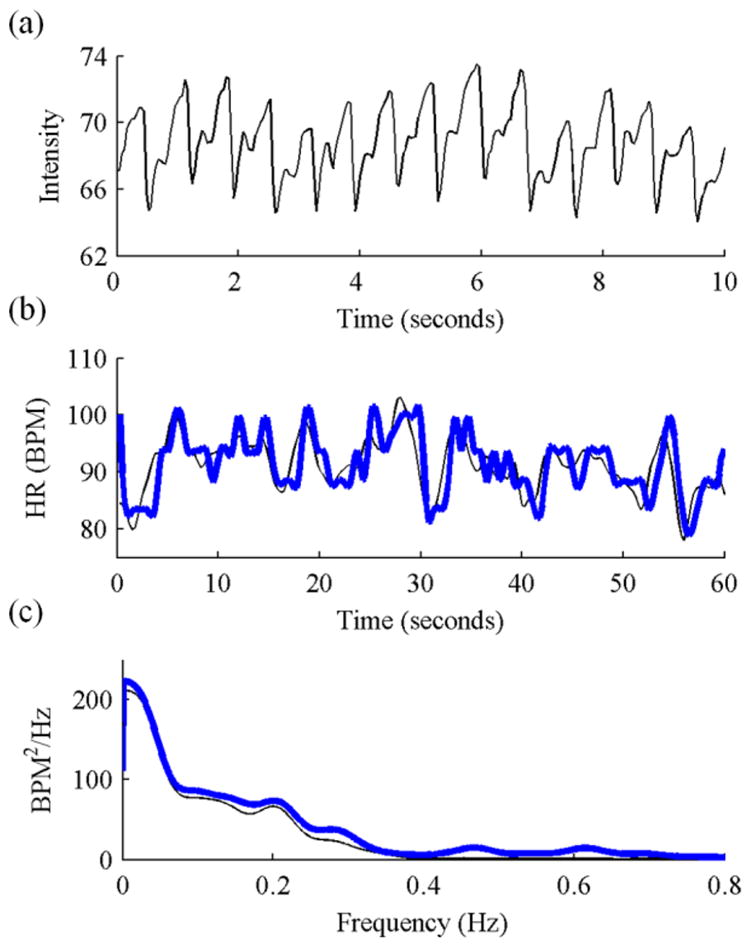
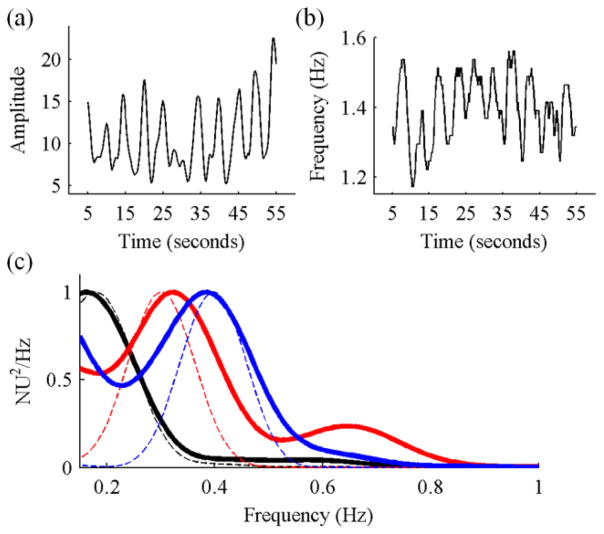
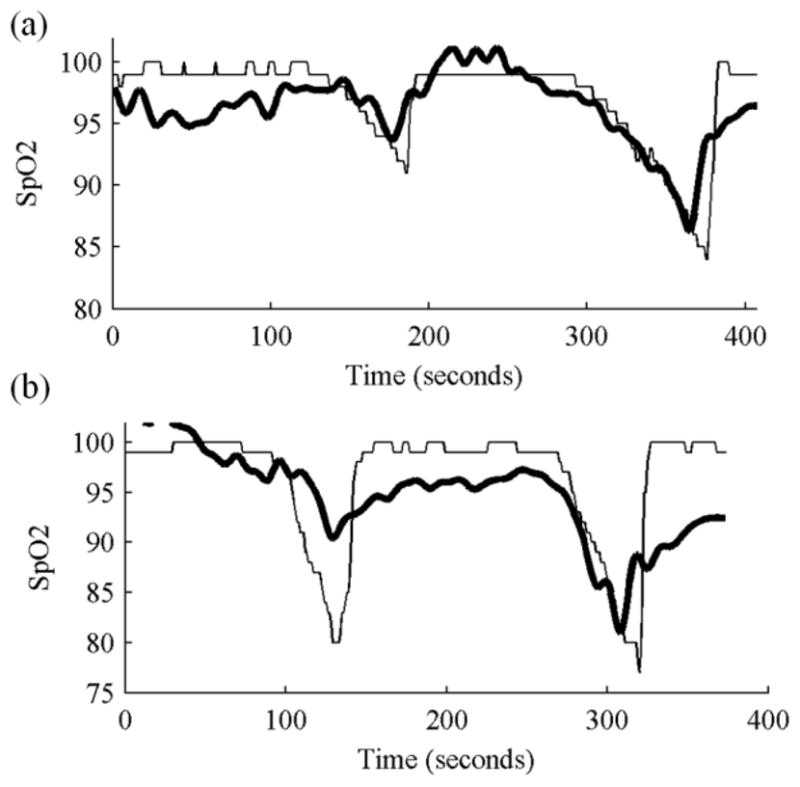
We show that a mobile phone can serve as an accurate monitor for several physiological variables, based on its ability to record and analyze the varying color signals of a fingertip placed in contact with its optical sensor. We confirm the accuracy of measurements of breathing rate, cardiac R-R intervals, and blood oxygen saturation, by comparisons to standard methods for making such measurements (respiration belts, ECGs, and pulse-oximeters, respectively). Measurement of respiratory rate uses a previously reported algorithm developed for use with a pulse-oximeter, based on amplitude and frequency modulation sequences within the light signal. We note that this technology can also be used with recently developed algorithms for detection of atrial fibrillation or blood loss.
© 2011 IEEE
Figures
References
-
- Kyriacou EC, Pattichis CS, Pattichis MS. An overview of recent health care support systems for eEmergency and mHealth applications. Conf Proc IEEE Eng Eng Med Biol Soc. 2009:1246–1249. - PubMed
-
- Poh MZ, McDuff DJ, Picard RW. Non-contact, automated cardiac pulse measurements using video imaging and blind source separation. Opt Express. 2010;18(10):10762–10774. - PubMed
-
- Jonathan E, Martin L. Investigating a smartphone imaging unit for photoplethysmography. Physiological Measurement. 2010;31(11):N79. - PubMed
-
- Jonathan E, Leahy MJ. Cellular phone-based photoplethysmographic imaging. Journal of Biophotonics. 2011;4(5):293–296. - PubMed
Publication types
MeSH terms
Grants and funding
LinkOut - more resources
Full Text Sources
Other Literature Sources
