. 2011 Sep 16;286(37):32454-63.
doi: 10.1074/jbc.M111.268136. Epub 2011 Jul 29.

The extracellular cAMP-adenosine pathway regulates expression of renal D1 dopamine receptors in diabetic rats

Affiliations

The extracellular cAMP-adenosine pathway regulates expression of renal D1 dopamine receptors in diabetic rats

Eldo V Kuzhikandathil et al. J Biol Chem. .

Abstract

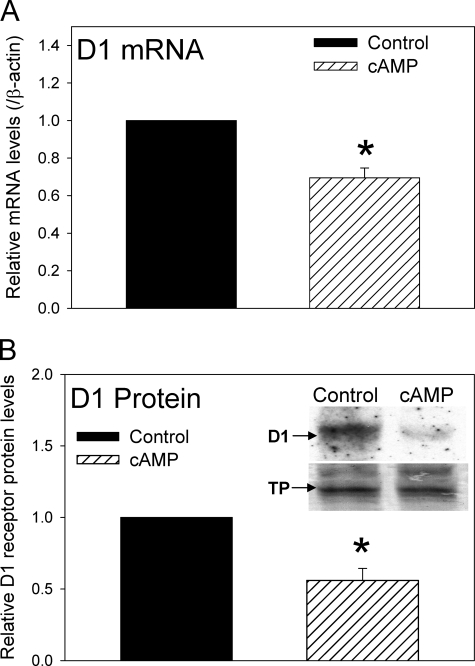
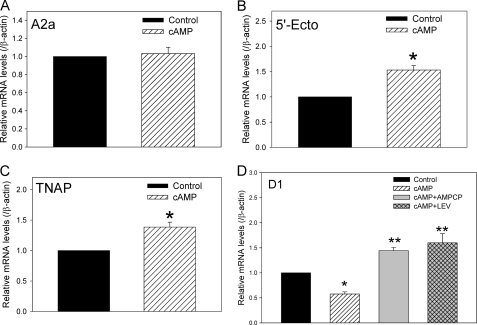
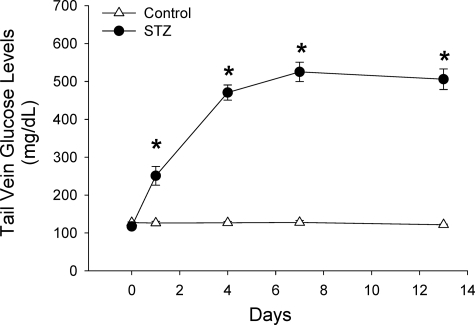
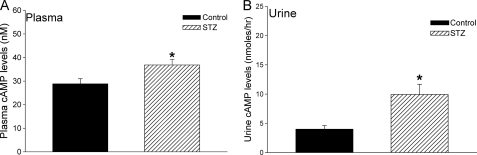
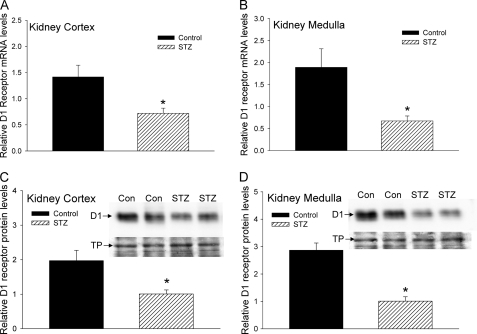
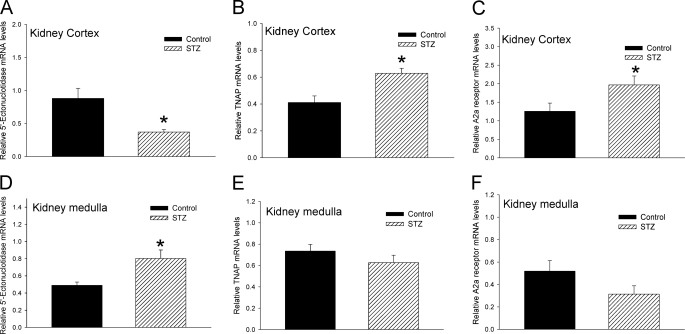
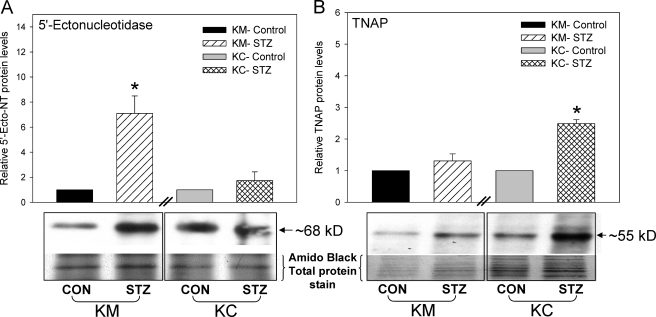
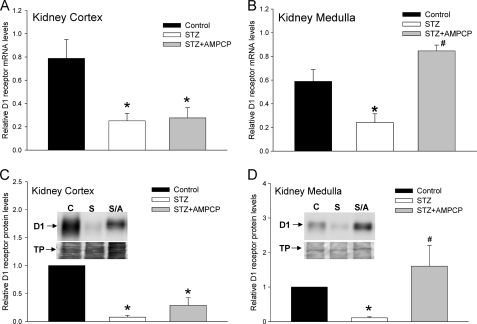
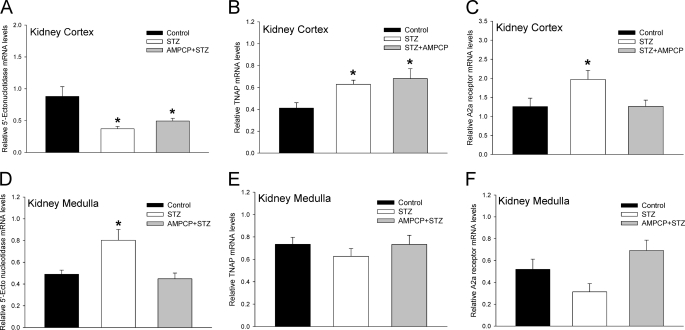
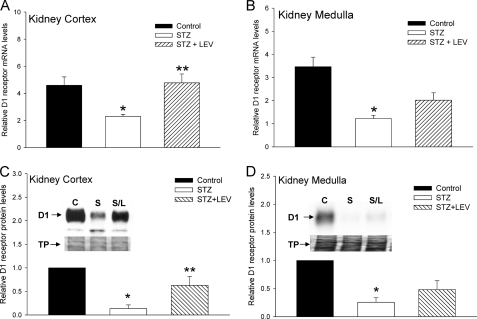
Activation of D1 dopamine receptors expressed in the kidneys promotes the excretion of sodium and regulates sodium levels during increases in dietary sodium intake. A decrease in the expression or function of D1 receptors results in increased sodium retention which can potentially lead to the development of hypertension. Studies have shown that in the absence of functional D1 receptors, in null mice, the systolic, diastolic, and mean arterial pressures are higher. Previous studies have shown that the expression and function of D1 receptors in the kidneys are decreased in animal models of diabetes. The mechanisms that down-regulate the expression of renal D1 receptor gene in diabetes are not well understood. Using primary renal cells and acutely isolated kidneys from the streptozotocin-induced rat diabetic model, we demonstrate that the renal D1 receptor expression is down-regulated by the extracellular cAMP-adenosine pathway in vitro and in vivo. In cultures of primary renal cells, a 3 mm, 60-h cAMP treatment down-regulated the expression of D1 receptors. In vivo, we determined that the plasma and urine cAMP levels as well as the expression of 5'-ectonucleotidase, tissue-nonspecific alkaline phosphatase, and adenosine A2a receptors are significantly increased in diabetic rats. Inhibitors of 5'-ectonucleotidase and tissue-nonspecific alkaline phosphatase, α,β-methyleneadenosine 5'-diphosphate, and levamisole, respectively, blocked the down-regulation of D1 receptors in the primary renal cells and in the kidney of diabetic animals. The results suggest that inhibitors of the extracellular cAMP-adenosine pathway reverse the down-regulation of renal D1 receptor in diabetes.


Figures

FIGURE 1.
FIGURE 1.
Effect of extracellular cAMP on the expression of D1 dopamine receptor gene in primary renal cells. A, cumulative data from real-time RT-PCR showing relative expression of D1 receptor mRNA in control cells (black bar) and cells treated with 3 mm 3′,5′-cAMP sodium salt (hatched bar) for 60 h. The D1 receptor mRNA levels were normalized to β-actin and then normalized to levels in control cells. *, p < 0.05, Student's t test. The results are from three independent experiments performed on primary renal cell cultures obtained from three animals. B, cumulative data and representative Western blots (inset) indicating the levels of D1 receptor protein in control cells and cells treated with 3 mm cAMP for 60 h. In the inset, the bottom panel shows the same blot as in top panel stained with Amido Black. The D1 receptor protein levels were normalized to Amido Black-stained total proteins (TP) and then normalized to levels in control cells. *, p < 0.05, Student's t test. Three independent experiments were performed. Error bars, S.E.
FIGURE 2.
FIGURE 2.
Effect of extracellular cAMP on the expression of ECA pathway genes in primary renal cells. A–C, cumulative data from real-time RT-PCR showing relative mRNA expression of adenosine A2a receptor (A), 5′-Ecto-NT (B), and TNAP (C) in control cells (black bar) and cells treated with 3 mm 3′,5′-cAMP sodium salt (hatched bar) for 60 h. The mRNA levels were normalized to β-actin and then normalized to levels in control cells. *, p < 0.05, Student's t test. Error bars, S.E. The results are from independent experiments performed on primary renal cell cultures obtained from three animals. D, cumulative data from real-time RT-PCR showing relative mRNA expression of D1 dopamine in control cells (black bar), cells treated with 3 mm 3′,5′-cAMP sodium salt (hatched bar), 3 mm cAMP + 0.3 mm AMP-CP (gray bar), or 3 mm cAMP + 1.0 mm levamisole (LEV, cross-hatched bar) for 60 h. The mRNA levels were normalized to β-actin and then normalized to levels in control cells. *, **, p < 0.05, ANOVA, post hoc SNK test. The results are from four independent experiments performed on primary renal cell cultures obtained from four animals.
FIGURE 3.
FIGURE 3.
STZ-treated rats sustain elevated blood glucose levels over a 14-day period. Blood glucose levels in control (vehicle; open triangles) and STZ-injected animals (filled circles) were measured on day of injection and subsequently on days 1, 4, 7, and 13. n = 9 animals for each treatment group. *, p < 0.05, Student's t test between control and STZ-treated animals on each day. Error bars, S.E.
FIGURE 4.
FIGURE 4.
Elevated cAMP levels in the plasma and urine of STZ-treated diabetic rats. Levels of cAMP in plasma (A) and urine (B) from control (vehicle, black bars) and STZ-injected rats (hatched bars) were measured on day 14 after treatment. Levels of cAMP are indicated in nanomolar for plasma and in nanomoles per hour for urine, as the urine sample was collected over a 6-h period. n = 9 animals for each treatment group. *, p < 0.05, Student's t test. Error bars, S.E.
FIGURE 5.
FIGURE 5.
Effect of STZ treatment on expression of D1 receptor gene in kidney cortex and medulla. A and B, cumulative data from real-time RT-PCR show relative expression of D1 receptor mRNA in kidney cortex (A) and medulla (B) of control (black bars) and STZ-treated rats (hatched bars) 14 days after injection. The D1 receptor mRNA levels were normalized to β-actin. C and D, cumulative data from Western blots show relative expression of D1 receptor protein in kidney cortex (C) and medulla (D) from control (black bars) and STZ-treated rats (hatched bars) 14 days after injection. Insets show representative Western blots (top panels, D1 receptor protein) and Amido Black stain of the same blot (bottom panels, TP). n = 8 animals for each treatment group. *, p < 0.05, Student's t test. Error bars, S.E.
FIGURE 6.
FIGURE 6.
Effect of STZ treatment on expression of ECA pathway genes in kidney cortex and medulla. Cumulative data from real-time RT-PCR show relative expression of 5′-Ecto-NT (A and D), TNAP (B and E), and adenosine A2a receptor (C and F) in kidney cortex (A–C) and medulla (D–F) of control (black bars) and STZ-treated rats (hatched bars) 14 days after injection. The mRNA levels were normalized to β-actin. n = 8 animals for each treatment group. *, p < 0.05, Student's t test. Error bars, S.E.
FIGURE 7.
FIGURE 7.
Effect of STZ treatment on expression of 5′-Ecto-NT and TNAP proteins in kidney cortex and medulla. Cumulative data and representative Western blots show 5′-ectonucleotidase (A) and TNAP (B) proteins in kidney cortex (KC) and medulla (KM) in control (CON) and STZ-injected rats 14 days after the treatment. Top panel, Western blots of 5′-Ecto-NT and TNAP. Bottom panels, Amido Black stains of the same blot. For each kidney region, the protein levels were normalized to Amido Black-stained total proteins and then normalized to levels in control cells. n = 5 animals for each treatment group. *, p < 0.05, Student's t test. Error bars, S.E.
FIGURE 8.
FIGURE 8.
Effect of AMP-CP on STZ-induced down-regulation of D1 receptor gene expression in kidney cortex and medulla. A and B, cumulative data from real-time RT-PCR show relative expression of D1 receptor mRNA in kidney cortex (A) and medulla (B) of control (black bars), STZ-treated (white bars), and STZ + AMP-CP-treated (gray bars) rats. AMP-CP (2.5 mg/kg, intramuscularly) was administered for 3 days, twice a day starting at day 11. Kidneys were harvested on day 14. The D1 receptor mRNA levels were normalized to β-actin. *, significantly different from control; #, significantly different from STZ-treated. *, p < 0.05, ANOVA, post hoc SNK test. n = 6 animals for each treatment group. C and D, cumulative data and representative Western blots (insets) indicate the levels of D1 receptor protein in kidney cortex (C) and medulla (D) from control, STZ-treated, and STZ + AMP-CP-treated rats. Bottom panels in the insets show Amido Black stain of the same blot. The D1 receptor protein levels were normalized to Amido Black-stained total proteins (TP) and then normalized to levels in control cells. *, significantly different from control; #, significantly different from STZ-treated. *, #, p < 0.05, ANOVA, post hoc SNK test. n = 5 animals for each treatment group. Error bars, S.E.
FIGURE 9.
FIGURE 9.
Effect of AMP-CP on STZ-induced changes in ECA pathway gene expression in kidney cortex and medulla. Cumulative data from real-time RT-PCR show relative expression 5′-Ecto-NT (A and D), TNAP (B and E), and adenosine A2a receptor (C and F) in kidney cortex (A–C) and medulla (D–F) of control (black bars), STZ-treated (white bars), and STZ + AMP-CP-treated (gray bars) rats. AMP-CP (2.5 mg/kg, intramuscularly) was administered for 3 days, twice a day starting at day 11. Kidneys were harvested on day 14. All mRNA levels were normalized to β-actin. *, p < 0.05, ANOVA, post hoc SNK test. n = 6 animals for each treatment group. Error bars, S.E.
FIGURE 10.
FIGURE 10.
Effect of levamisole on STZ-induced down-regulation of D1 receptor gene expression in kidney cortex and medulla. A and B, cumulative data from real-time RT-PCR show relative expression of D1 receptor mRNA in kidney cortex (A) and medulla (B) of control (black bars), STZ-treated (white bars), and STZ + levamisole (LEV)-treated (hatched bars) rats. Levamisole (3 mg/kg, intraperitoneally) was administered for 3 days, twice a day starting at day 11. Kidneys were harvested on day 14. The D1 receptor mRNA levels were normalized to β-actin. *, significantly different from control; **, significantly different from STZ-treated. *, **, p < 0.05, ANOVA, post hoc SNK test. n = 6 animals for each treatment group. C and D, cumulative data and representative Western blots (insets) indicate the levels of D1 receptor protein in kidney cortex (C) and medulla (D) from control, STZ-treated, and STZ + levamisole-treated rats. Bottom panels in the insets shows Amido Black stains of the same blot. The D1 receptor protein levels were normalized to Amido Black-stained total proteins (TP) and then normalized to levels in control cells. *, significantly different from control; **, significantly different from STZ-treated. *, **, p < 0.05, ANOVA, post hoc SNK test. n = 6 animals for each treatment group. Error bars, S.E.

Similar articles

Cited by

References

    1. McDonald R. H., Jr., Goldberg L. I., McNay J. L., Tuttle E. P., Jr. (1964) J. Clin. Invest. 43, 1116–1124 - PMC - PubMed
    1. Hussain T., Lokhandwala M. F. (2003) Exp. Biol. Med. 228, 134–142 - PubMed
    1. Missale C., Nash S. R., Robinson S. W., Jaber M., Caron M. G. (1998) Physiol. Rev. 78, 189–225 - PubMed
    1. Aperia A. C. (2000) Annu. Rev. Physiol. 62, 621–647 - PubMed
    1. Albrecht F. E., Drago J., Felder R. A., Printz M. P., Eisner G. M., Robillard J. E., Sibley D. R., Westphal H. J., Jose P. A. (1996) J. Clin. Invest. 97, 2283–2288 - PMC - PubMed

Publication types

LinkOut - more resources