. 2011 Nov;39(21):9093-107.
doi: 10.1093/nar/gkr591. Epub 2011 Jul 29.

Measuring cell identity in noisy biological systems

Affiliations

Measuring cell identity in noisy biological systems

Kenneth D Birnbaum et al. Nucleic Acids Res. 2011 Nov.

Abstract

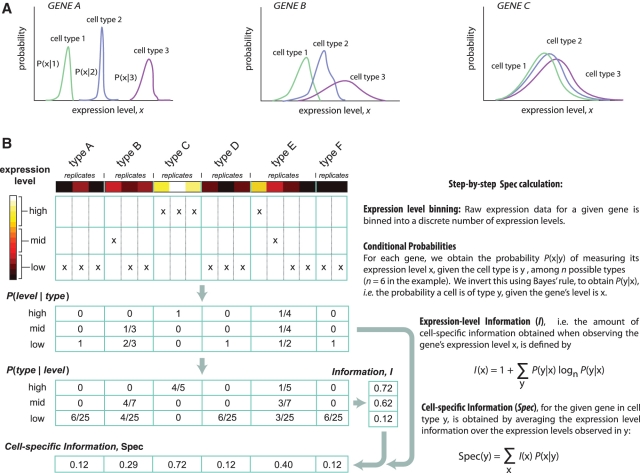
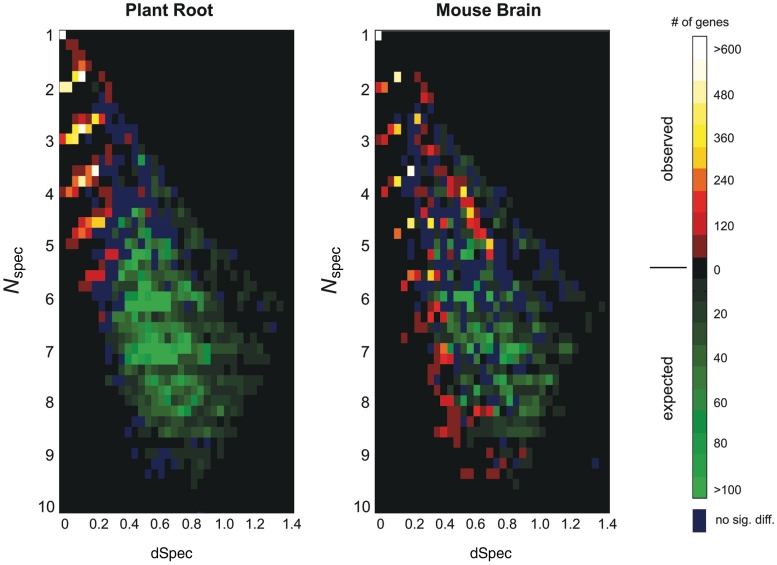
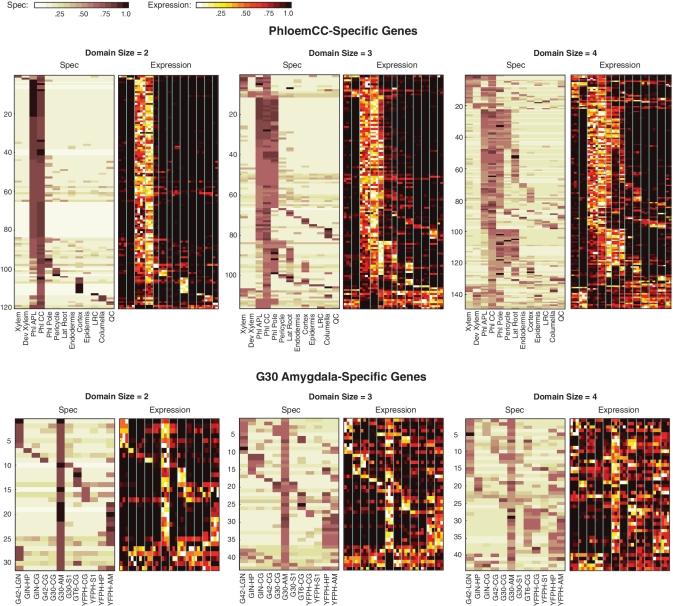
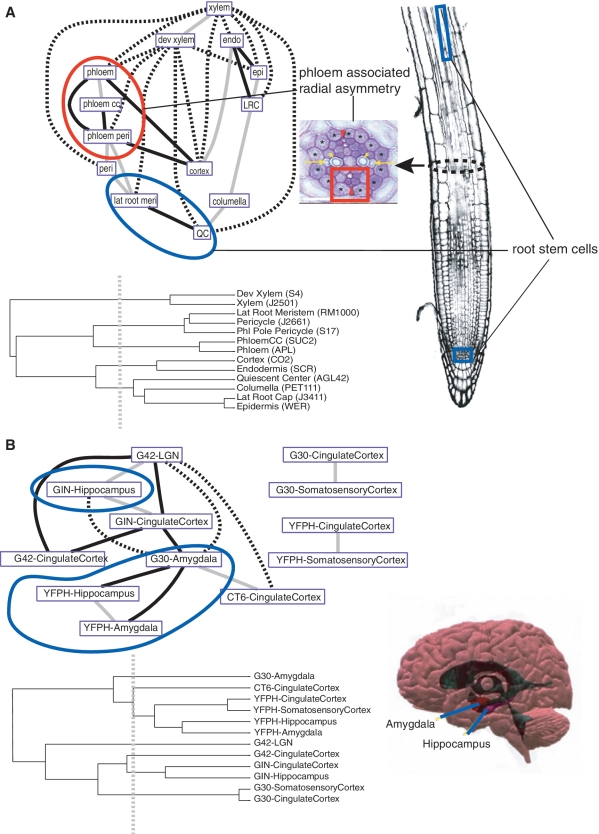
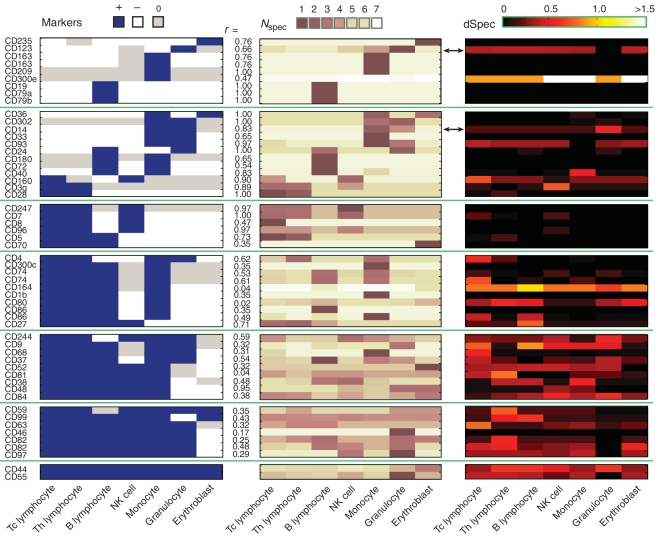
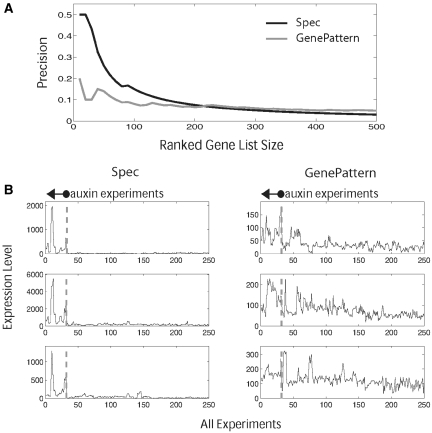
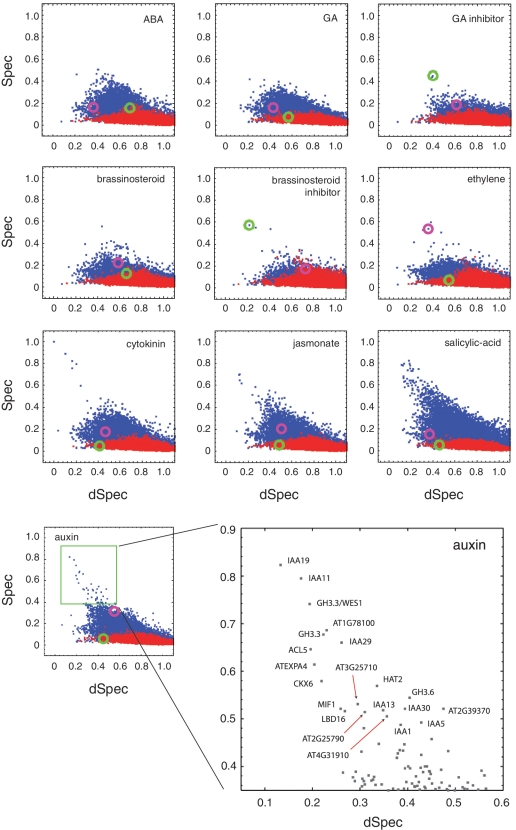
Global gene expression measurements are increasingly obtained as a function of cell type, spatial position within a tissue and other biologically meaningful coordinates. Such data should enable quantitative analysis of the cell-type specificity of gene expression, but such analyses can often be confounded by the presence of noise. We introduce a specificity measure Spec that quantifies the information in a gene's complete expression profile regarding any given cell type, and an uncertainty measure dSpec, which measures the effect of noise on specificity. Using global gene expression data from the mouse brain, plant root and human white blood cells, we show that Spec identifies genes with variable expression levels that are nonetheless highly specific of particular cell types. When samples from different individuals are used, dSpec measures genes' transcriptional plasticity in each cell type. Our approach is broadly applicable to mapped gene expression measurements in stem cell biology, developmental biology, cancer biology and biomarker identification. As an example of such applications, we show that Spec identifies a new class of biomarkers, which exhibit variable expression without compromising specificity. The approach provides a unifying theoretical framework for quantifying specificity in the presence of noise, which is widely applicable across diverse biological systems.


Figures

Figure 1.
Figure 1.
Method overview and examples. (A) Idealized profiles of cell type-specific gene expression for two genes in three different cell types. Gene A exhibits highly specific expression profiles in each cell type, with no discernible overlap of distribution. Gene B exhibits distinct profiles in each cell type, with overlapping distributions, reducing the specificity of expression. Gene C exhibits no discernible specificity. (B) Overview of the specificity value, Spec. The mathematical formulation of Spec is general (right panel), and the quantity conceptually does not depend on any cutoffs, thresholds, or other details of a binning procedure; Spec depends exclusively on P(x|y), the underlying distribution of gene expression levels in each cell type. To measure Spec using microarray data, a binning procedure is used (left panel), whereby gene expression measurements in each cell type and replicate experiment (colored squares) are binned into several discrete levels (three are used here).
Figure 2.
Figure 2.
Genomic distribution of cell specificity. Microarray data from 12 neuronal cell types and 11 789 genes in mouse and from 13 root tip cell types and 17 270 genes in Arabidopsis were used after filtered for uniquely mapping probes. The cell specificity index (Spec) was computed for each gene in each cell type. The cell type y* with highest Spec value was found for each gene. To assess significance for each dataset, we generated a shuffled dataset, by randomly permuting expression levels within each cell type across all genes. The distribution of [Nspec(y*), dSpec(y*)] over all genes is shown in shades of red (observed); the same distribution computed over a shuffled dataset is shown in shades of green (expected). Since the distributions overlap, each bin is colored according to the distribution whose value is larger, by a factor of two or more. Bins in which the observed and expected distributions do not differ by this criterion are colored dark blue; likewise in dark blue are bins which did not show a significant difference between the two distributions, based on a P-value < 0.001 criterion, computed using the Poisson distribution with the expected mean. Black bins are exclusively those for which both distributions are zero.
Figure 3.
Figure 3.
Expression domains of genes across cell types. Data is shown for Arabidopsis phloem companion cells and for the mouse G30-amygdala cells. For each cell type, three plots are given, representing domains of size 2, 3 and 4. For domain size D, we included all genes whose D lowest Nspec(y) values were <D + 0.5, and which had all other Nspec(y) values greater than D + 1. We required that the D cell types with lowest Nspec(y) values include the given cell type (phloem companion or G30-amygdala). Both Spec and raw expression data are shown. Genes are sorted according to the order (left to right) of the D cell types in the gene's domain, and further sorted according to the Spec value of the left-most cell type in the domain. Additionally, genes exhibiting low expression in the cell type of maximal Spec are sorted to the bottom of the plot, allowing these genes to be easily noticed visually.
Figure 4.
Figure 4.
Cell-type affinities in the Arabidopsis root and mouse brain. In Spec network representations, each edge represents a major pattern that linked the two cell types via a large number of genes (>100 genes in Arabidopsis; >50 genes in mouse) whose expression domains overlapped both cell types (see ‘Materials and Methods’ section). Dendrograms depict cell-type affinities using a similarity matrix of Pearson correlation of overall gene expression values. Gray edges in network represent cell types with high similarity in the tree where their ancestral node meets less than half the maximal distance. Black edges show cellular affinities that are distant in the similarity tree where their ancestral node meets at greater than half the maximal distance. Broken lines are longest distance relationships in the tree where their ancestral node is basal. (A) Phloem cells (red arrowheads) share a gene regulatory set (red circle) with adjoining pericycle cells (asterisks), showing a molecular domain of radial asymmetry (red square); radial asymmetry subfigure is reproduced from Figure 1b of (44); root subfigure was previously published in (3). QC cells, which support the growth of the primary meristem, share a strong affinity with lateral root meristem cells, which support the growth of lateral roots (blue circle). (B) Cells in the core of the limbic system of mouse, amygdala and hippocampus (blue circle), show strong affinities in the Spec network despite differences in the genetic background from which they came. In the similarity tree, some of the same cell types (e.g. amygdala cell samples) show distant relationships; brain subfigure is reproduced from http://stuff4educators.com/web_images/amygdala_hippocampus.jpg.
Figure 5.
Figure 5.
Validation of Spec against well-documented white blood cell markers. (left panels) The heatmap depicts the known expression profile (18) of 51 CD markers in the seven cell types tested (see ‘Materials and Methods’ section). Positive markers (blue), negative markers (white) and unspecified markers (gray) are indicated. From top to bottom, groups of rows show markers expressed in an increasing number of cell types, from one cell type (top rows) to seven cell types (bottom rows). Three markers that had two probes each are listed twice (CD163, probes ILMN_1722622/ILMN_1733270; CD74, probes ILMN_1736567/ILMN_1761464; and CD86, probes ILMN_1651349/ILMN_1714602). (Middle panels) The heatmap shows the Nspec values for the makers calculated from expression data (17) (‘Materials and Methods’ section). The Pearson correlations, r, between marker values (−1, 0, 1) and Nspec values are listed, and indicate a high level of concordance for markers expressed in up to three cell types between known cell-surface expression patterns (left panels) and Nspec values calculated from expression profiles (middle panels). A heatmap of dSpec values (right panels) for each gene in each cell type shows the level and cell-type distribution of noise for each gene, indicating a trend of decreasing robustness for more widely expressed genes. Arrows indicate the two examples that are discussed in the text.
Figure 6.
Figure 6.
Biomarker discovery performance for Spec and GenePattern. (A) The graph shows the precision (true positive/total positive cases) of each biomarker approach in identifying 221 documented auxin-responsive markers among profiles of 17 285 genes in a series of 13 different hormone treatments. The identity of markers was obtained from literature, not from the data itself. For every gene, each method generates a marker score for each hormone [e.g. Spec(auxin)] and genes were ranked from highest to lowest score in the auxin category, using only those genes in which the auxin score was highest among all hormones. To obtain the precision of each method at a given ranked gene list size (i.e. top 20 genes, top 40 genes, etc), the number of true hits in the list were tallied and divided by the list size. (B) Within the top 500 ranking genes for each approach, graphs show the expression patterns of the highest-ranking documented auxin markers discovered by one method but not the other. The graph shows expression in all the experiments used by each method to evaluate the markers, with the auxin experiments highlighted nearest to the origin.
Figure 7.
Figure 7.
Hormone-specific gene expression. Data from 250 experiments conducted in many different laboratories, in which specific hormone treatments were administered, was analyzed with hormone types taking the place of cell types in the analysis (see ‘Materials and Methods’ section). In each panel, labeled by the hormone type y, each gene was plotted as a single blue point at position [Spec(y), dSpec(y)]; red points represent the shuffled dataset. A brassinosteroid-responsive protein (brassinosteroid-6-oxidase 2, green circle) and an auxin-responsive protein (AT4G34770, purple circle) are highlighted for illustrative purposes. The auxin panel is shown in an enlarged view below, and the highly specific genes are labeled according to their genomic annotations. Several of the well-characterized auxin-responsive genes (IAA's) are seen to exhibit a high amount of noise across the multiple datasets used here; they are nevertheless among the most specifically expressed genes as measured by Spec. We note that each laboratory's control (null treatment) experiments were not used as part of this analysis as the meta-analysis, in effect, used all data for comparisons. Spec and dSpec values were computed using three expression level bins.

Similar articles

Cited by

References

    1. Gould J, Getz G, Monti S, Reich M, Mesirov JP. Comparative gene marker selection suite. Bioinformatics. 2006;22:1924–1925. - PubMed
    1. Espinosa-Soto C, Wagner A. Specialization can drive the evolution of modularity. PLoS Comput. Biol. 2010;6:e1000719. - PMC - PubMed
    1. Arendt D. The evolution of cell types in animals: emerging principles from molecular studies. Nat. Rev. Genet. 2008;9:868–882. - PubMed
    1. Sugino K, Hempel CM, Miller MN, Hattox AM, Shapiro P, Wu C, Huang ZJ, Nelson SB. Molecular taxonomy of major neuronal classes in the adult mouse forebrain. Nat. Neurosci. 2006;9:99–107. - PubMed
    1. Birnbaum K, Shasha DE, Wang JY, Jung JW, Lambert GM, Galbraith DW, Benfey PN. A gene expression map of the Arabidopsis root. Science. 2003;302:1956–1960. - PubMed

Publication types