Clinical Trial
. 2011 Sep 29;118(13):3603-12.
doi: 10.1182/blood-2011-05-352492. Epub 2011 Jul 29.

The phosphoinositide 3'-kinase delta inhibitor, CAL-101, inhibits B-cell receptor signaling and chemokine networks in chronic lymphocytic leukemia

Affiliations
Clinical Trial

The phosphoinositide 3'-kinase delta inhibitor, CAL-101, inhibits B-cell receptor signaling and chemokine networks in chronic lymphocytic leukemia

Julia Hoellenriegel et al. Blood. .

Abstract

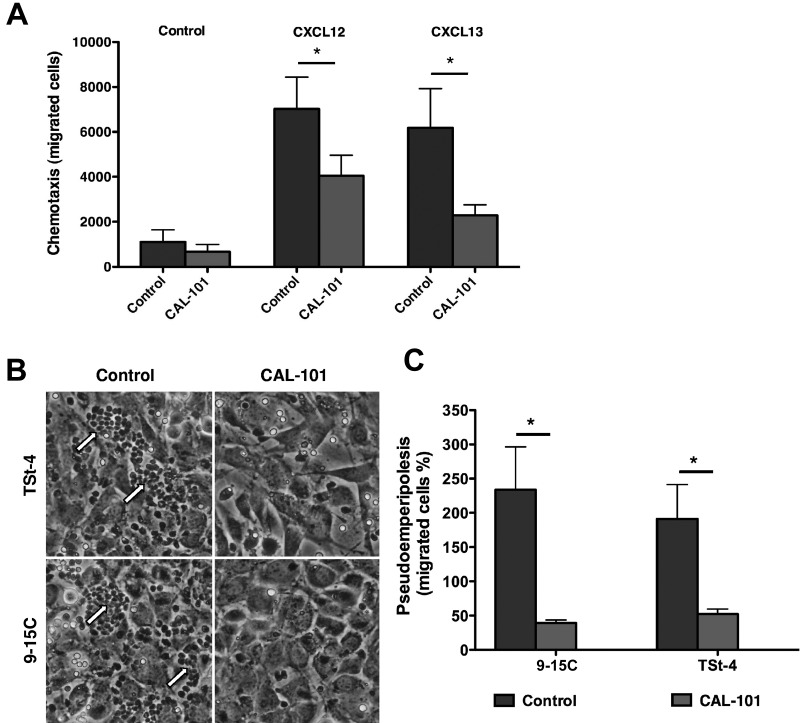
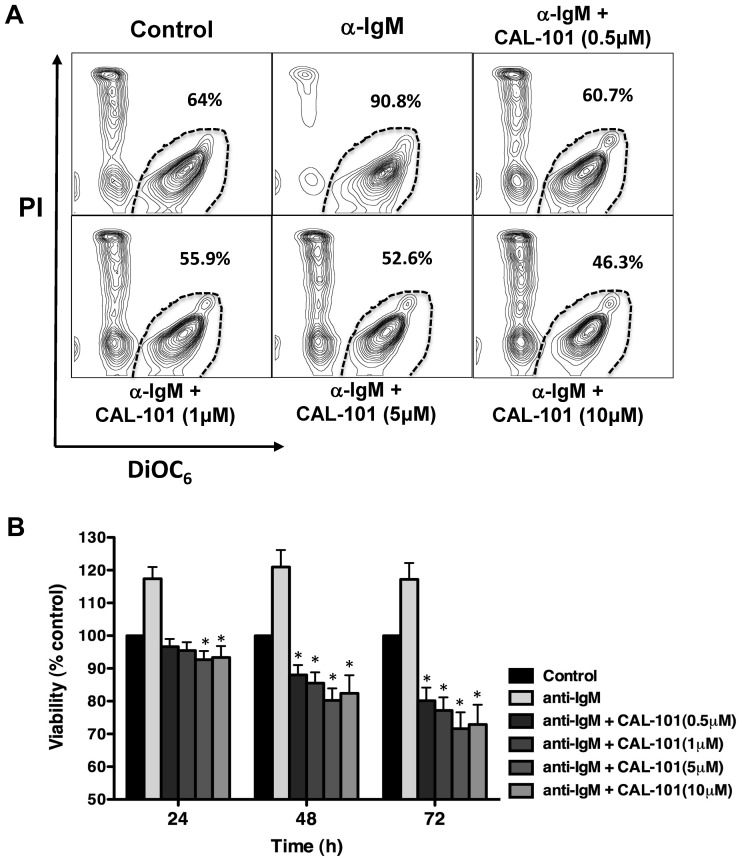
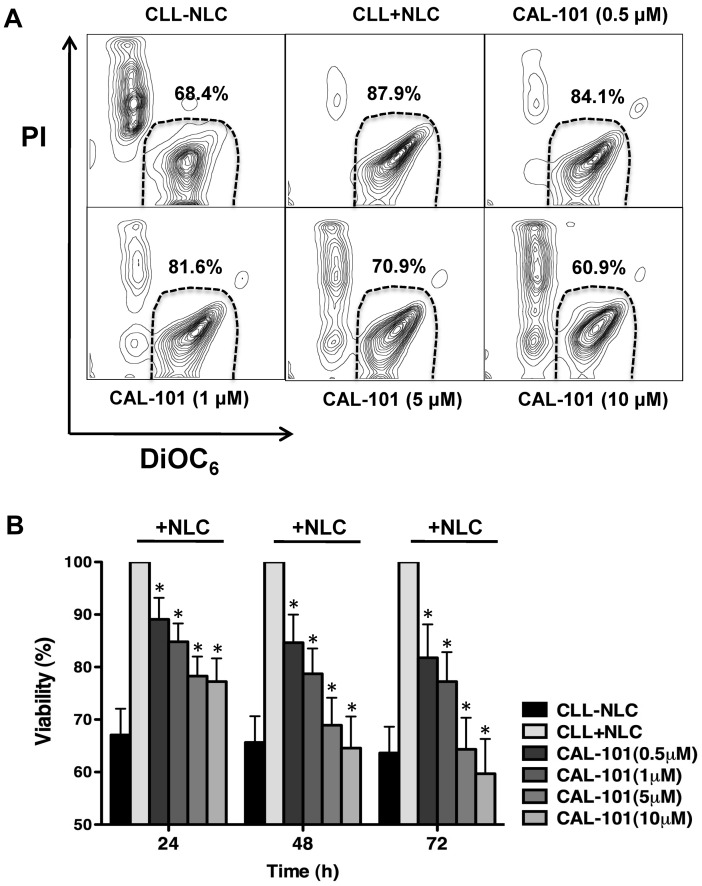
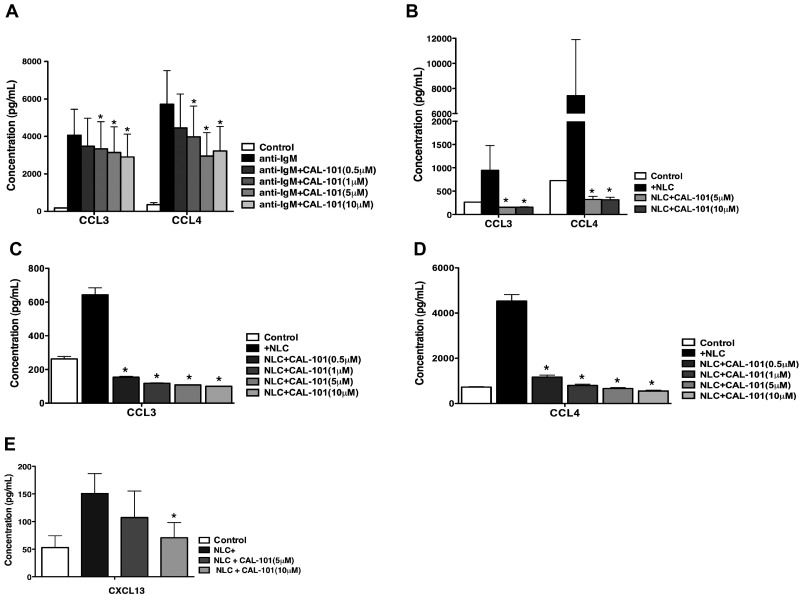
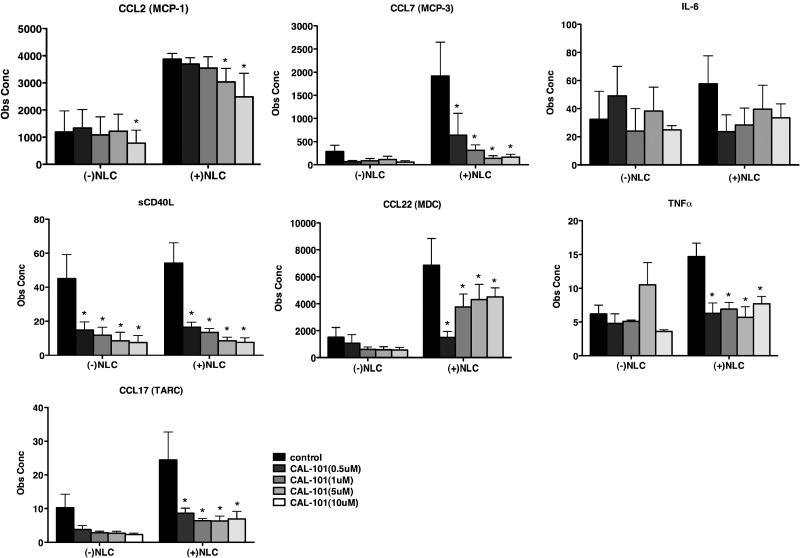
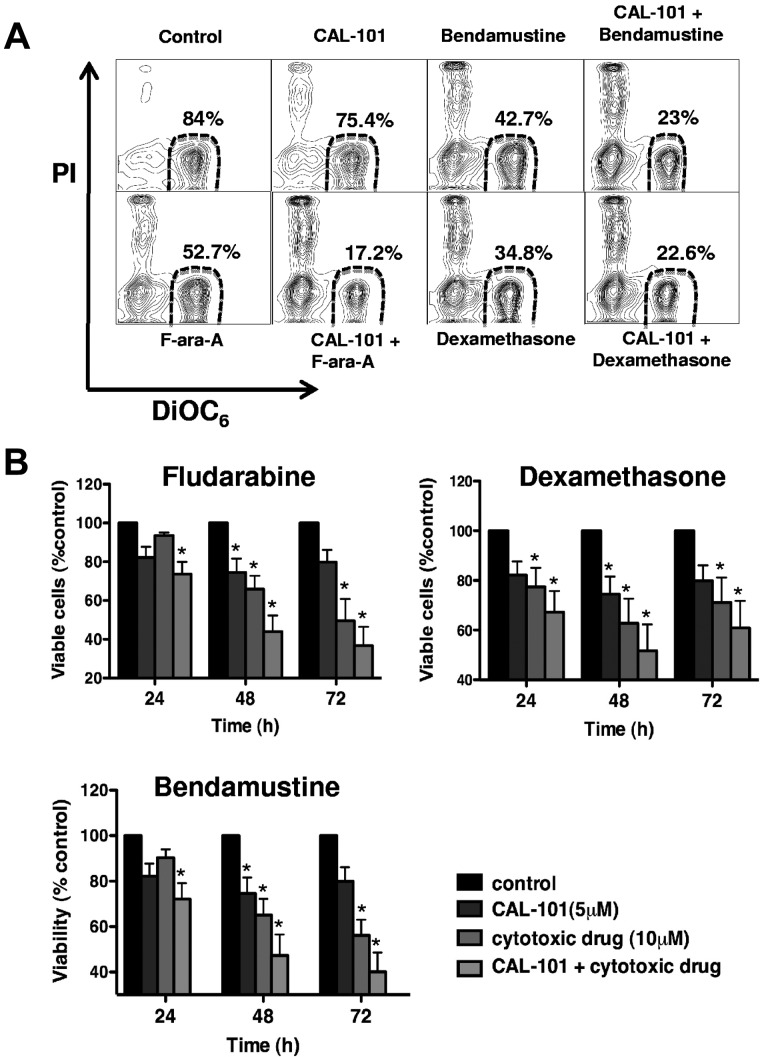
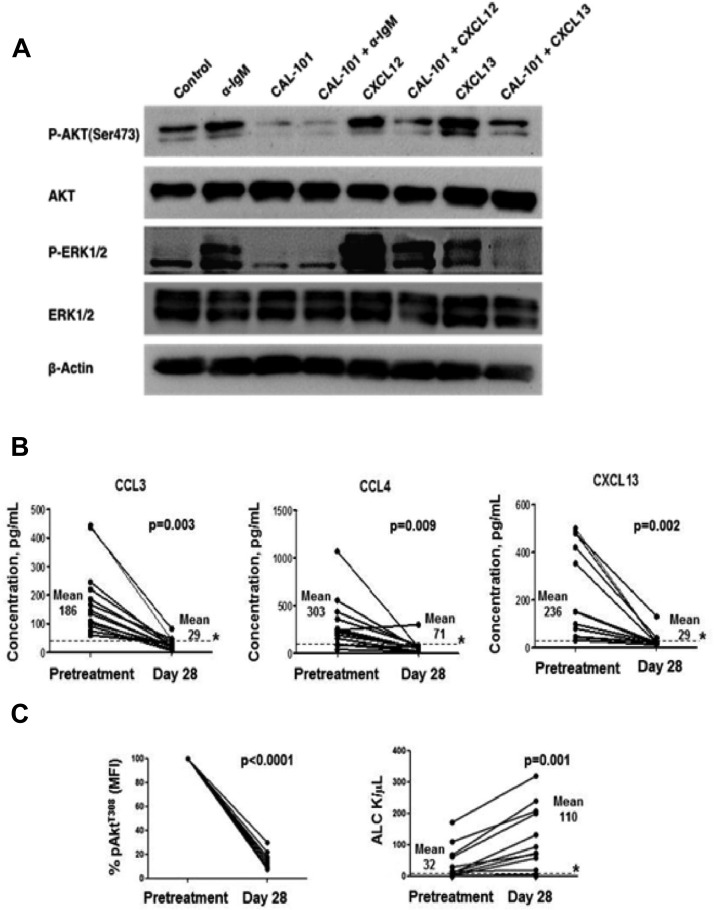
In lymphocytes, the phosphoinositide 3'-kinase (PI3K) isoform p110δ (PI3Kδ) transmits signals from surface receptors, including the B-cell receptor (BCR). CAL-101, a selective inhibitor of PI3Kδ, displays clinical activity in CLL, causing rapid lymph node shrinkage and a transient lymphocytosis. Inhibition of pro-survival pathways, the presumed mechanism of CAL-101, does not explain this characteristic pattern of activity. Therefore, we tested CAL-101 in assays that model CLL-microenvironment interactions in vitro. We found that CAL-101 inhibits CLL cell chemotaxis toward CXCL12 and CXCL13 and migration beneath stromal cells (pseudoemperipolesis). CAL-101 also down-regulates secretion of chemokines in stromal cocultures and after BCR triggering. CAL-101 reduces survival signals derived from the BCR or from nurse-like cells, and inhibits BCR- and chemokine-receptor-induced AKT and MAP kinase (ERK) activation. In stromal cocultures, CAL-101 sensitizes CLL cells toward bendamustine, fludarabine, and dexamethasone. These results are corroborated by clinical data showing marked reductions in circulating CCL3, CCL4, and CXCL13 levels, and a surge in lymphocytosis during CAL-101 treatment. Thus, CAL-101 displays a dual mechanism of action, directly decreasing cell survival while reducing interactions that retain CLL cells in protective tissue microenvironments. These data provide an explanation for the clinical activity of CAL-101, and a roadmap for future therapeutic development.


Figures

Figure 1
Figure 1
CAL-101 inhibits CLL cell chemotaxis toward CXCL12 and CXCL13 and migration beneath MSCs (pseudoemperipolesis). (A) CLL cells were incubated in medium alone (control) or medium containing 5μM CAL-101, and then allowed to migrate towards 200 ng/mL CXCL12 or 1 μg/mL CXCL13; or control cells without chemokine. The bar diagram represents the mean chemotaxis (± SEM) of CLL cells from 10 different patients in the presence or absence of CAL-101. Chemotaxis toward both CXCL12 and CXCL13 was significantly inhibited by CAL-101, with P < .05, as indicated by the asterisks. (B) Representative phase-contrast photomicrographs displaying CLL cell migration beneath TSt-4 or 9-15C stromal cells when CLL were either untreated (control) or pretreated with 5μM CAL-101 (CAL-101). Pseudoemperipolesis is characterized by the dark appearance of CLL cells that have migrated into the same focal plane as the stromal cells. There are numerous migrated CLL cells in the control wells (on the left), as indicated by the arrows, but only a few such cells in wells containing CLL cells pretreated with CAL-101 (on the right). (C) The bar diagram represents the mean pseudoemperipolesis (± SEM) of CLL cells from 9 different patients beneath of each of the 2 types of stromal cells in the presence or absence of CAL-101. Pseudoemperipolesis beneath TSt-4 or 9-15C stromal cells was significantly inhibited by CAL-101, with P < .05, as indicated by the asterisks.
Figure 2
Figure 2
Specific PI3Kδ inhibition with CAL-101 induces CLL apoptosis and abrogates BCR-derived survival signals. (A) CLL cells were incubated in medium alone (control), medium containing 10 μg/mL of anti-IgM mAbs, or medium with anti-IgM mAbs and various concentrations of CAL-101. Displayed are representative contour plots that depict CLL cell viability after 48 hours and after post staining with DiCO6 and PI (horizontal and vertical axes, respectively). The viable cell population is characterized by bright DiCO6 staining and PI exclusion, and is gated in the bottom right corner of each contour plot. The percentage of viable cells is displayed above each of these gates. (B) The bar diagram represents the mean relative viabilities of CLL cells cultured in complete medium (control), or medium supplemented with 10 μg/mL of anti-IgM, or anti-IgM and various concentrations of CAL-101. Viabilities in CAL-101–treated samples were normalized to the viabilities of control samples at the respective timepoints (100%) to account for differences in spontaneous apoptosis in samples from different patients. Displayed are the means (± SEM) from 15 different patient samples, assessed after 24, 48, and 72 hours. CLL cell survival in the presence of anti-IgM mAbs was significantly inhibited by CAL-101, with P < .05, as indicated by the asterisks describing the comparison of results from each culture containing CAL-101 to the results from the culture containing anti-IgM alone.
Figure 3
Figure 3
CAL-101 antagonizes NLC-mediated CLL cell survival. (A) CLL cells were cultured alone (control), cocultured with NLCs in medium alone or in medium containing various concentrations of CAL-101. Displayed are representative contour plots that depict CLL cell viability after 48 hours and after staining with DiOC6 and PI (horizontal and vertical axes, respectively). The viable cell population is characterized by bright DiOC6 staining and PI exclusion, and is gated in the bottom right corner of each contour plot. The percentage of viable cells is displayed above each of these gates. (B) The bar diagram represents the mean relative viabilities of CLL cells cocultured with NLCs compared with CLL cells alone (control) and cocultured with NLCs plus various concentrations of CAL-101. Viabilities of CAL-101–treated samples were normalized to the viabilities of control samples at the respective timepoints (100%). Displayed are the means (± SEM) from 12 different patient samples, assessed after 24, 48, and 72 hours. CLL cell survival in the presence of NCLs was significantly inhibited by CAL-101, with P < .05, as indicated by the asterisks describing the comparison of results from each culture containing CAL-101 to the results from the control culture.
Figure 4
Figure 4
NLC- and BCR-induced secretion of the chemokines, CCL3, CCL4, and CXCL13 by CLL cells is inhibited by CAL-101. (A) The bar diagram represents the mean supernatant concentrations of CLL3 and CCL4 from CLL cells cultured in complete medium (control), medium supplemented with 10 μg/mL of anti-IgM, or anti-IgM and various concentrations of CAL-101. Displayed are the mean (± SEM) supernatant concentrations from 5 different patient samples assessed after 24 hours. The secretion of CCL3 and CCL4 from CLL cells in the presence of anti-IgM mAbs was significantly inhibited by CAL-101, with P < .05, as indicated by the asterisks describing the comparison of results from each culture containing CAL-101 to the results from the culture containing anti-IgM alone. (B) This bar diagram represents the mean CLL cell supernatant concentrations for CCL3 and CCL4 from CLL cells cocultured with or without (controls) NLCs. Displayed are the means (± SEM) from 5 different patient samples, assessed after 24 hours. The secretion of CCL3 and CCL4 from CLL cells was significantly inhibited by CAL-101, with P < .05, as indicated by the asterisks, describing the comparison of results from each culture containing CAL-101 to the results from the control culture. Lower concentrations of CAL-101, which are indicated next to each bar diagram and depicted by different shades of gray, also significantly reduced CCL3 (C) and CCL4 (D) concentrations in CLL-NLC cocultures (n = 3). (E) This bar diagram represents mean (± SEM) supernatant CXCL13 concentrations from CLL cells cultured alone or cocultured with NLC from 5 different patients, assessed after 24 hours. The secretion of CXCL13 was reduced by CAL-101, with P < .05, as indicated by the asterisks describing the comparison of results from each culture containing CAL-101 to the results from control cultures.
Figure 5
Figure 5
CAL-101 alters chemokine and cytokine secretion of CLL cells in coculture with NLCs. The bar diagrams represent the mean CLL cell supernatant concentrations for various chemokines and cytokines from CLL cells culture alone or cocultured with NLCs. Displayed are the means (± SEM) from 7 different patient samples, assessed after 24 hours. The secretion of some chemokines was significantly inhibited by CAL-101, with P < .05, as indicated by the asterisks describing the comparison of results from each culture containing CAL-101 to the results from the relevant control culture.
Figure 6
Figure 6
CAL-101 enhances the activity of several different cytotoxic agents against CLL cells cocultured with MSCs. (A) CLL cells were cocultured with MSCs in medium alone (control) or in medium containing the indicated concentrations of CAL-101, dexamethasone, bendamustine, or fludarabine, or the drugs combined. Displayed are representative contour plots that depict CLL cell viability after 48 hours and after staining with DiOC6 and PI (horizontal and vertical axes, respectively). The viable cell population is characterized by bright DiOC6 staining and PI exclusion, and is gated in the lower right corner of each contour plot. The percentage of viable cells is displayed above each of these gates. (B) The bar diagram represents the mean relative viabilities of CLL cells cocultured with MSCs and the indicated concentrations of CAL-101, dexamethasone, bendamustine, fludarabine, or the drugs combined. Viabilities of drug-treated samples were normalized to the viabilities of control samples at the respective timepoints (100%). Displayed are the means (± SEM) from 9 different patient samples, assessed after 24, 48, and 72 hours. CLL cell survival in the presence of MSC was significantly reduced by combination therapy, with P < .05, as indicated by the asterisks describing the comparison of results from each drug-treated culture to the results from the control culture. Similar data were generated with lower CAL-101 concentration (1μM, 0.5μM, and 0.1μM; see supplemental Figure 4).
Figure 7
Figure 7
CAL-101 inhibits signaling downstream of the BCR, CXCR4 and CXCR5. In vivo, CAL-101 reduces plasma chemokine levels, impairs AKT activation, and induces lymphocytosis in CLL patients. (A) CLL cells were activated with anti-IgM, or CXCL12, or CXCL13 in the presence or absence of CAL-101. Lysates were probed with phospho-specific antibodies to AKT and ERK1/2, and antibodies for total AKT, ERK1/2, and actin. (B-C) Plasma chemokine levels, AKT phosphorylation, and lymphocyte counts were evaluated in 12 CLL patients pretreatment and after 28 days on treatment with CAL-101. (B) The line graphs represent concentrations of CCL3, CCL4, and CXCL13 in plasma samples from CLL patients before and after 28 days of CAL-101 treatment. Displayed are the individual values. * represents the upper limit of normal. Chemokine values in the plasma from patients were significantly reduced by CAL-101. (C) The bar diagram represents the mean relative phospho-AktT308 fluorescence intensity values (adjusted for isotype control) derived from circulating CLL cells in patients undergoing CAL-101 treatment. Displayed are the means (± SEM). Akt phosphorylation in CLL cells from patients was significantly inhibited by CAL-101. The line graphs indicate the absolute lymphocyte counts in patients with CLL undergoing CAL-101 treatment. Displayed are the individual values. * represents the upper limit of normal. Absolute lymphocyte counts were significantly increased by CAL-101.

References

    1. Chiorazzi N, Rai KR, Ferrarini M. Chronic lymphocytic leukemia. N Engl J Med. 2005;352(8):804–815. - PubMed
    1. Lagneaux L, Delforge A, Bron D, De Bruyn C, Stryckmans P. Chronic lymphocytic leukemic B cells but not normal B cells are rescued from apoptosis by contact with normal bone marrow stromal cells. Blood. 1998;91(7):2387–2396. - PubMed
    1. Burger JA, Tsukada N, Burger M, Zvaifler NJ, Dell'Aquila M, Kipps TJ. Blood-derived nurse-like cells protect chronic lymphocytic leukemia B cells from spontaneous apoptosis through stromal cell-derived factor-1. Blood. 2000;96(8):2655–2663. - PubMed
    1. Burger JA, Ghia P, Rosenwald A, Caligaris-Cappio F. The microenvironment in mature B-cell malignancies: a target for new treatment strategies. Blood. 2009;114(16):3367–3375. - PMC - PubMed
    1. Burger JA, Burger M, Kipps TJ. Chronic lymphocytic leukemia B cells express functional CXCR4 chemokine receptors that mediate spontaneous migration beneath bone marrow stromal cells. Blood. 1999;94(11):3658–3667. - PubMed

Publication types

MeSH terms