. 2011 Oct;21(10):1705-19.
doi: 10.1101/gr.122747.111. Epub 2011 Jul 29.

True single-molecule DNA sequencing of a pleistocene horse bone

Affiliations

True single-molecule DNA sequencing of a pleistocene horse bone

Ludovic Orlando et al. Genome Res. 2011 Oct.

Abstract

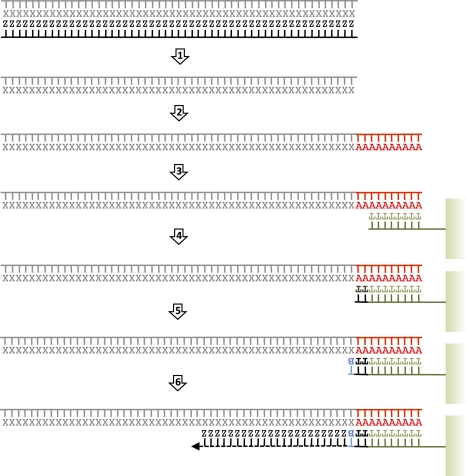
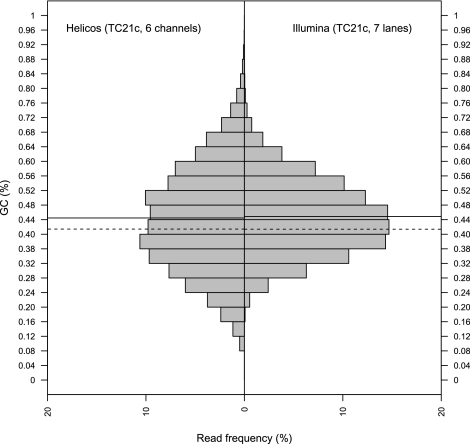
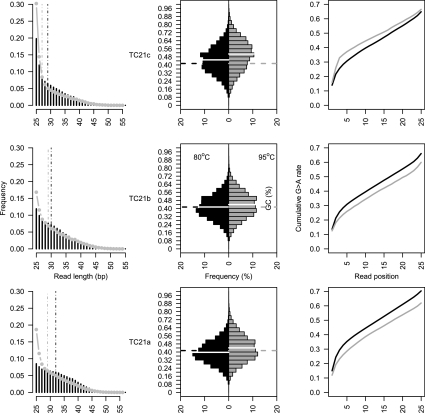
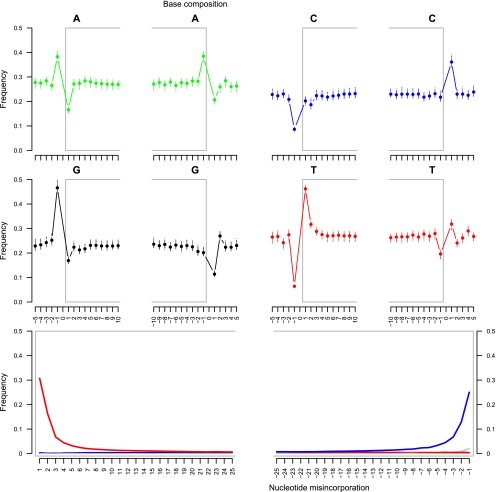
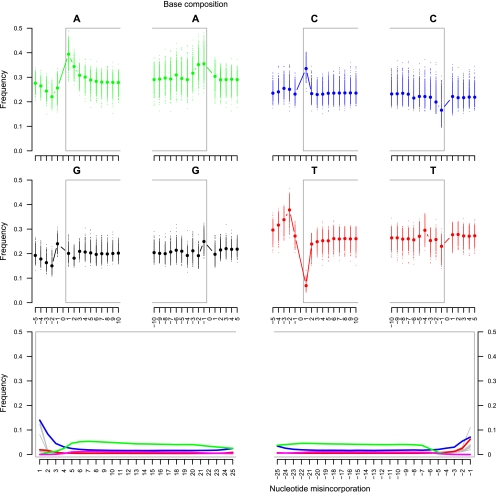
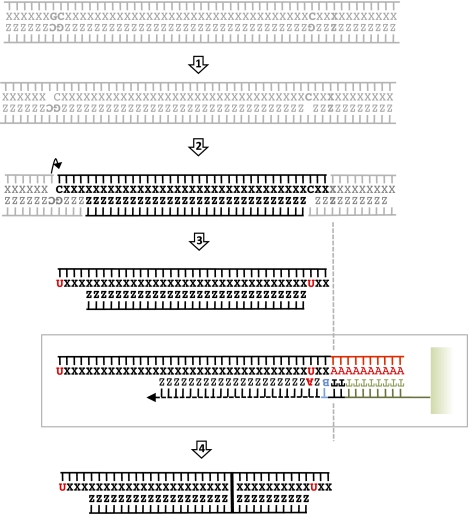
Second-generation sequencing platforms have revolutionized the field of ancient DNA, opening access to complete genomes of past individuals and extinct species. However, these platforms are dependent on library construction and amplification steps that may result in sequences that do not reflect the original DNA template composition. This is particularly true for ancient DNA, where templates have undergone extensive damage post-mortem. Here, we report the results of the first "true single molecule sequencing" of ancient DNA. We generated 115.9 Mb and 76.9 Mb of DNA sequences from a permafrost-preserved Pleistocene horse bone using the Helicos HeliScope and Illumina GAIIx platforms, respectively. We find that the percentage of endogenous DNA sequences derived from the horse is higher among the Helicos data than Illumina data. This result indicates that the molecular biology tools used to generate sequencing libraries of ancient DNA molecules, as required for second-generation sequencing, introduce biases into the data that reduce the efficiency of the sequencing process and limit our ability to fully explore the molecular complexity of ancient DNA extracts. We demonstrate that simple modifications to the standard Helicos DNA template preparation protocol further increase the proportion of horse DNA for this sample by threefold. Comparison of Helicos-specific biases and sequence errors in modern DNA with those in ancient DNA also reveals extensive cytosine deamination damage at the 3' ends of ancient templates, indicating the presence of 3'-sequence overhangs. Our results suggest that paleogenomes could be sequenced in an unprecedented manner by combining current second- and third-generation sequencing approaches.


Figures

Figure 1.
Figure 1.
Helicos tSMS: an overview (adapted from Hart et al. 2010 and reprinted with permission from Elsevier Ltd. © 2010). Ancient DNA molecules are denatured into single strands (step 1), tailed with poly(A) (step 2), and captured by oligo-dT-50 oligonucleotide probes covalently linked onto the surface of 25-channels flow-cell (step 3). A fill-in reaction is elicited with dTTP in order to fill any remaining nucleotide complementary to the poly(A) tail (step 4). Nucleic acid templates are then locked in place by the addition of dCTP, dGTP, and dATP virtual terminator (VT, here labeled B) nucleotides that inhibit extension prior to terminator cleavage (step 5). Sequencing-by-synthesis is initiated through the addition of one of the four one-color Cy-5 labeled VT nucleotide (step 6). The incorporation of fluorescence to the elongated DNA strand is measured using laser illumination and a CCD camera after unincorporated nucleotides have been rinsed. The fluorescent label is further cleaved and the incorporation of another labeled VT nucleotide is challenged. Standard sequencing runs complete 120 cycles of nucleotide additions. Ancient DNA, which is extremely fragmented, does not require further shearing before poly(A) tailing.
Figure 2.
Figure 2.
GC composition of Illumina and Helicos horse reads. For comparison, we considered only the reads generated from the same extract (TC21c) and denaturation temperatures of 80°C and 95°C. Similar distributions were recovered when considering the total number of Helicos reads generated for other extracts. (Left) Helicos; (right) Illumina. Full lines refer to the observed average read GC content. The expected average GC content of genomic fragments of 31 bp (Helicos read median) is estimated using 361,379 randomly sampled fragments of the horse reference genome (see Supplemental text) and is reported in dashed lines (41.41%). A similar estimate (41.38%) is provided for Illumina sequencing reads using 299,256 randomly sampled fragments of 67 bp, in agreement with the median of Illumina sequences.
Figure 3.
Figure 3.
The distribution of Helicos reads is dependent on the initial denaturation temperature. Three different extracts (top: TC21c; middle: TC21b; bottom: TC21a) have been sequenced on the same Helicos run (six channels) following identical procedures, except that either mild (80°C, black) or high (95°C, gray) temperatures were used for denaturation. (Left) Read length distribution. For extracts TC21c, TC21b, and TC21a, the median read size was 29, 30, and 32 bp when DNA denaturation was performed at 80°C (black dashed lines) in contrast to 27, 29, and 29 bp at 95°C (gray dashed lines). (Middle) Read GC contents. White full lines refer to average read GC contents; the expected genomic GC content (41.4%) is reported with dashed lines. (Right) Cumulative guanine to adenine misincorporation rates as a function of the distance from sequencing start.
Figure 4.
Figure 4.
Illumina sequencing: DNA fragmentation and nucleotide misincorporation patterns on ancient horse reads. (Top, middle) The base composition of the reads is reported for the first 10 nucleotides sequenced (left: 1–10) as well as for the five nucleotides located upstream of the genomic region aligned to the reads (left: −5 to −1). In addition, the base composition of the last 10 nucleotides sequenced (right: −10 to −1) and of the five nucleotides located downstream from the reads (right: 1–5) in the genome equCab2 is provided. Nucleotide positions located within reads are reported with a gray frame. Each dot reports the average base composition per position as estimated from reads mapping against chromosomes 1–31 and X. The range of the base composition per individual chromosome is also reported. (Bottom) The frequencies of all possible mismatches and indels observed between the horse genome and the reads are reported in gray as a function of distance for 5′- to 3′-ends (first 25 nucleotides sequenced) and 3′- to 5′- (last 25 nucleotides), except for C→T and G→A, which are reported in red and blue, respectively. The latter variations range from 0.6% to 30.7% per site (5′- to 3′- end) or 0.7%–25.1% per site (3′- to 5′- end) and exceed the variations observed for other misincorporation types that are consequently mostly hidden in the figures (<0.1%–0.9% per site). The misincorporation frequencies are calculated by dividing the total number of occurrences of the modified base at a given position in a read by the total number of the unmodified base at the same position in the horse genome.
Figure 5.
Figure 5.
Helicos sequencing: DNA fragmentation and nucleotide misincorporation patterns on ancient horse reads. (Top, middle) The base composition of the reads is reported for the first 10 nucleotides sequenced (left: 1–10) as well as for the five nucleotides located upstream of the genomic region aligned to the reads (left: −5 to −1). In addition, the base composition of the last 10 nucleotides sequenced (right: −10 to −1) and of the five nucleotides located downstream from the reads (right: 1–5) in the genome equCab2 is provided. Nucleotide positions located within reads are reported with a gray frame. Each dot reports the average base composition per position as estimated from reads mapping against chromosomes 1–31 and X. The range of the base composition per individual chromosome is also reported. (Bottom) The frequencies of all possible mismatches and indels observed between the horse genome and the reads are reported in gray as a function of distance for 5′- to 3′-ends (first 25 nucleotides sequenced) and 3′- to 5′- (last 25 nucleotides), except for C→T, G→A, deletions, and insertions that are reported in red, blue, green, and pink, respectively. These frequencies are calculated by dividing the total number of occurrences of the modified base at a given position in a read by the total number of the unmodified base at the same position in the horse genome. For indels, the latter corresponds to the total number of bases observed at the considered position.
Figure 6.
Figure 6.
Ancient DNA damage: a profile. After depurination (step 1), internal AP-sites are subject to β-elimination (arrow, step 2), which opens the phosphodiester bond mainly for 3′ of AP-sites. In addition, DNA strands are subject to single-strand breaks. As a result of terminal transferase preference for 3′-hydroxy ends, most abasic sites located 3′ of the aDNA fragment will not be poly(A) tailed, unless the nucleotidic sugar is further degraded. Such termini are not represented, albeit they are likely to represent a significant fraction of aDNA templates. Cytosine deamination in uracils occurs much faster on single-stranded parts of DNA (step 3) and results in increased G→A misincorporation rates at the beginning of Helicos sequence reads. Other types of damages, such as interstrand cross-links, which affect aDNA molecules (and hamper further sequence characterization), are not reported.

References

    1. Binladen J, Wiuf C, Gilbert MTP, Bunce M, Barnett R, Larson G, Greenwood AD, Haile J, Ho SYW, Hansen AJ, et al. 2006. Assessing the fidelity of ancient DNA sequences amplified from nuclear genes. Genetics 172: 733–741 - PMC - PubMed
    1. Bowers J, Mitchell J, Beer E, Buzby PR, Causey M, Efcavitch JW, Jarosz M, Krzymanska-Olejnik E, Kung L, Lipson D, et al. 2009. Virtual terminator nucleotides for next-generation DNA sequencing. Nat Methods 6: 593–595 - PMC - PubMed
    1. Bramanti B, Thomas MG, Haak W, Unterlaender M, Jores P, Tambets K, Antanaitis-Jacobs I, Haidle MN, Jankauskas R, Kind C-J, et al. 2009. Genetic discontinuity between local hunter-gatherers and Europe's first farmers. Science 326: 137–140 - PubMed
    1. Briggs AW, Stenzel U, Johnson PLF, Green RE, Kelso J, Prufer K, Meyer M, Krause J, Ronan MT, Lachmann M, et al. 2007. Patterns of damage in genomic DNA sequences from a Neandertal. Proc Natl Acad Sci 104: 14616–14621 - PMC - PubMed
    1. Briggs AW, Good JM, Green RE, Krause J, Maricic T, Stenzel U, Lalueza-Fox C, Rudan P, Brajkovic D, Kucan Z, et al. 2009. Targeted retrieval and analysis of five Neandertal mtDNA genomes. Science 325: 318–321 - PubMed

Publication types

LinkOut - more resources