. 2011 Aug;59(8):727-40.
doi: 10.1369/0022155411410885.

Biodistribution of small interfering RNA at the organ and cellular levels after lipid nanoparticle-mediated delivery

Affiliations

Biodistribution of small interfering RNA at the organ and cellular levels after lipid nanoparticle-mediated delivery

Bin Shi et al. J Histochem Cytochem. 2011 Aug.

Abstract

Chemically stabilized small interfering RNA (siRNA) can be delivered systemically by intravenous injection of lipid nanoparticles (LNPs) in rodents and primates. The biodistribution and kinetics of LNP-siRNA delivery in mice at organ and cellular resolution have been studied using immunofluorescence (IF) staining and quantitative polymerase chain reaction (qPCR). At 0.5 and 2 hr post tail vein injection of Cy5-labeled siRNA encapsulated in LNP, the organ rank-order of siRNA levels is liver > spleen > kidney, with only negligible accumulation in duodenum, lung, heart, and brain. Similar conclusions were drawn by using qPCR to measure tissue siRNA levels as a secondary end point. siRNA levels in these tissues decreased by more than 10-fold after 24 hr. Within the liver, LNPs delivered siRNA to hepatocytes, Kupffer cells, and sinusoids in a time-dependent manner, as revealed by IF staining and signal quantitation methods established using OPERA/Columbus software. siRNA first accumulated in liver sinusoids and trafficked to hepatocytes by 2 hr post dose, corresponding to the onset of target mRNA silencing. Fluorescence in situ hybridization methods were used to detect both strands of siRNA in fixed tissues. Collectively, the authors have implemented a platform to evaluate biodistribution of siRNA across cell types and across tissues in vivo, with the objective of elucidating the pharmacokinetic and pharmacodynamic relationship to guide optimization of delivery vehicles.


Conflict of interest statement

All authors are full-time employees of Merck & Co, Inc.

Figures

Figure 1.
Figure 1.
Small interfering RNA (siRNA) and mRNA detection in CD1 mice. (A, C) Stem-loop quantitative polymerase chain reaction (qPCR) was applied to detect siRNA levels in different organs of mouse (A) and different lobes of liver (C). siRNA levels measured from medial lobes of liver were plotted in (A). siRNA delivered mainly to liver and spleen, much less in kidney and lung, and in small amounts in brain and duodenum (A). The levels of siRNA decreased in the liver from 0.5 to 24 hr post dosing (C). No significant difference was observed among different lobes of liver at each time point (C). (B, D) Sjogren syndrome antigen B (Ssb) mRNA was measured in different organs (liver, spleen, lung, kidney, heart, duodenum, and brain) and in different lobes of rat liver (caudate, right lateral, left lateral, and medial lobes). (B) Nearly 85% knockdown of mRNA seen in liver and 30% in spleen at 24 hr. No statistical significant knockdown was observed in other organs. (D) Similar degree of mRNA knockdown observed across lobes of livers, except caudate lobe, which showed similar level of knockdown but had an original increase of Ssb mRNA post LNP–siRNA treatment at 0.5 hr. **p < 0.01, ****p < 0.0001, one-way ANOVA followed by Dunnett multiple comparison test.
Figure 2.
Figure 2.
Cy5–small interfering RNA (siRNA) biodistribution in mouse liver and in spleen. Sections were stained with phalloidin (green) and counterstained with DAPI (blue). (A–D) Cy5–siRNA distributed in the liver is time dependent. (A) 30 min, (B) 2 hr, (C) 24 hr, and (D) PBS control. (E–H) Overlaid images of Cy5 (purple) and phalloidin outlined liver cells (green) and nuclei (DAPI blue) for the time points corresponding to A–D. Abundant Cy5 signals detected in the sinusoids of liver; diffuse Cy5 siRNA signals detected in liver parenchyma starting at 30 min post dose, lasting at least 24 hr. (I–L) Cy5–siRNA detected in the red pulp of spleen at 30 min (I), 2 hr (J), and 24 hr (K); PBS control in (L). V for central veins or portal veins of the liver. W for white pulp and R for red pulp of the spleen.
Figure 3.
Figure 3.
Cy5–small interfering RNA (siRNA) biodistribution in different lobes of mouse livers: Four slices of liver from caudate, left, right, and medial lobes are illustrated in A, which is stained with phalloidin (green) and DAPI (blue). LNP201–siRNA–Cy5 was dosed for 0.5 hr (D, E) and 2 hr (A, B, C). Enlarged images from medial lobe were illustrated in B and C. At the same scale, images from a medial lobe of 0.5 hr dosing group were illustrated in D and E. Cy5–siRNA is purple in B and D. Overlaid images of Cy5, phalloidin (green), and DAPI nuclei (blue) showed in C and E. Cy5–siRNA signals relatively evenly distributed in the entire liver and no Cy5 signals inside the veins. Arrow heads indicate zone I, portal triad areas. Arrow indicates zone III, central vein area. Zone II is the area between I and III.
Figure 4.
Figure 4.
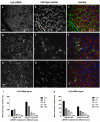
Identification of cell markers of mouse liver (A-I). Quantification of Cy5–small interfering RNA (siRNA) signals in the sinusoids and hepatocytes (J) and in Kupffer cells (KCs) and non-KC areas (K). Images were taken from liver sections 2 hr post lipid nanoparticle 201 (LNP201)–siRNA–Cy5 3 mpk dose. (A, D, G) Cy5–siRNA signals. (B) Collagen IV outlined sinusoids. (E) CD68-stained Kupffer cells. (H) Desmin-stained Ito cells and their protrusions. (C, F, I) Overlay images for Cy5–siRNA (red), cell markers (green), and nuclei (DAPI, blue). (J) Columbus quantification of Cy5–siRNA intensity in hepatocytes and sinusoids from collagen-stained liver sections. (K) Columbus quantification of Cy5–siRNA intensity in KCs and non-KC areas from CD68-stained liver sections. Two-way ANOVA was performed for J and K, where p < 0.001 for time and location.
Figure 5.
Figure 5.
Fluorescence in situ hybridization (FISH) to detect small interfering RNA (siRNA) distribution on frozen mouse liver sections. Mice were dosed with lipid nanoparticle 201–Ssb siRNA without any labels for 2 hr at 3 and 9 mpk. The frozen liver sections were stained by FISH (green signals in A, D, C, and F). The same tissue sections were also stained with anti-CD68 (red) for Kupffer cells (B, E, and H). Mouse dosed with PBS served as control where no FISH signals were detected (G and I). FTIC (Fluorescein isothiocyanate) green channel represents tyramide amplificed FISH signals.

Similar articles

Cited by

References

    1. Abrams MT, Koser ML, Seitzer J, Williams SC, DiPietro MA, Wang W, Shaw AW, Mao X, Jadhav V, Davide JP, et al. 2010. Evaluation of efficacy, biodistribution, and inflammation for a potent siRNA nanoparticle: effect of dexamethasone co-treatment. Mol Ther. 18:171–180 - PMC - PubMed
    1. Ali MM, Yoo B, Pagel MD. 2009. Tracking the relative in vivo pharmacokinetics of nanoparticles with PARACEST MRI. Mol Pharm. 6:1409–1416 - PMC - PubMed
    1. Aouadi M, Tesz GJ, Nicoloro SM, Wang M, Chouinard M, Soto E, Ostroff GR, Czech MP. 2009. Orally delivered siRNA targeting macrophage Map4k4 suppresses systemic inflammation. Nature. 458:1180–1184 - PMC - PubMed
    1. Baldwin L, Flanagan BF, Hunt JA. 2005. Flow cytometric measurement of phagocytosis reveals a role for C3b in metal particle uptake by phagocytes. J Biomed Mater Res A. 73:80–85 - PubMed
    1. Baratta JL, Ngo A, Lopez B, Kasabwalla N, Longmuir KJ, Robertson RT. 2009. Cellular organization of normal mouse liver: a histological, quantitative immunocytochemical, and fine structural analysis. Histochem Cell Biol. 131:713–726 - PMC - PubMed