. 2011 Sep;22(9):1631-41.
doi: 10.1681/ASN.2010111144. Epub 2011 Jul 29.

Uremia alters HDL composition and function

Affiliations

Uremia alters HDL composition and function

Michael Holzer et al. J Am Soc Nephrol. 2011 Sep.

Abstract

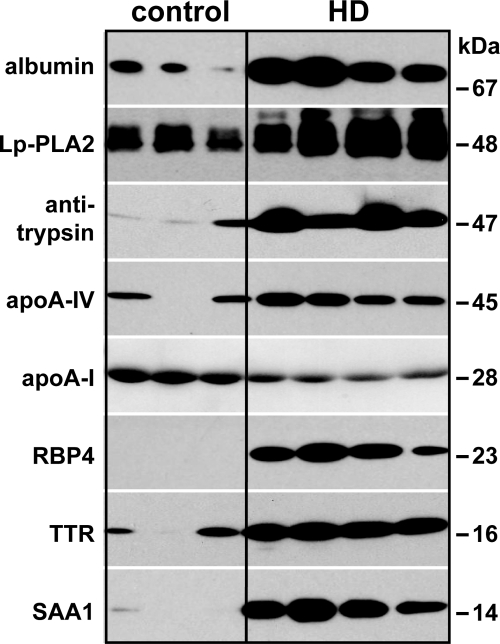
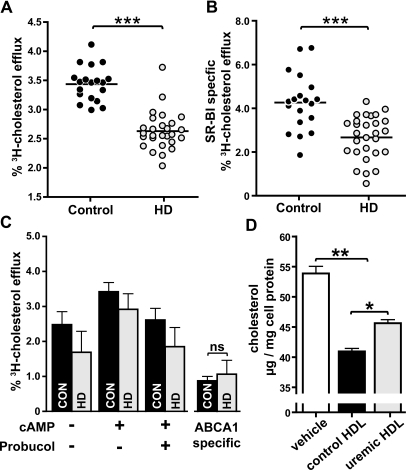
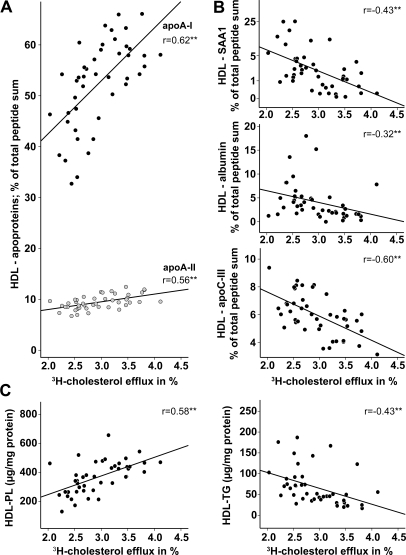
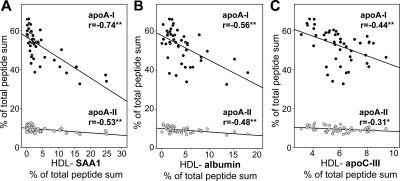
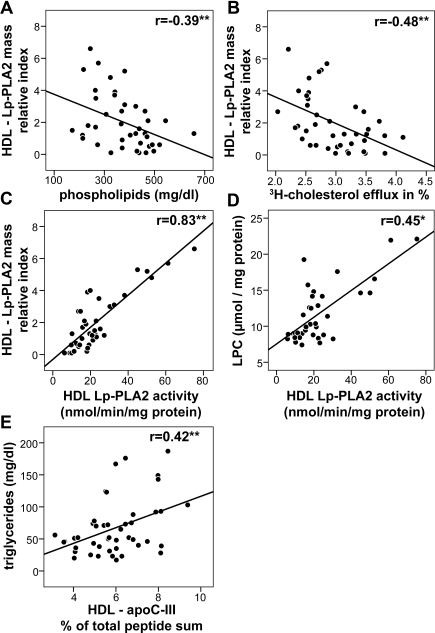
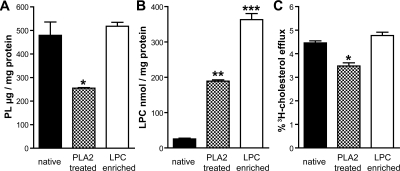
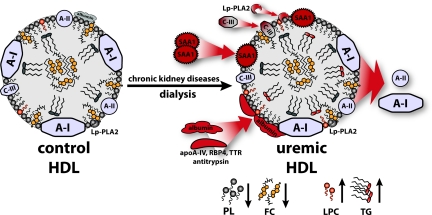
Functional impairment of HDL may contribute to the excess cardiovascular mortality experienced by patients with renal disease, but the effect of advanced renal disease on the composition and function of HDL is not well understood. Here, we used mass spectrometry and biochemical analyses to study alterations in the proteome and lipid composition of HDL isolated from patients on maintenance hemodialysis. We identified a significant increase in the amount of acute phase protein serum amyloid A1, albumin, lipoprotein-associated phospholipase A2, and apoC-III composing uremic HDL. Furthermore, uremic HDL contained reduced phospholipid and increased triglyceride and lysophospholipid. With regard to function, these changes impaired the ability of uremic HDL to promote cholesterol efflux from macrophages. In summary, the altered composition of HDL in renal disease seems to inhibit its cardioprotective properties. Assessing HDL composition and function in renal disease may help identify patients at increased risk for cardiovascular disease.


Figures

Figure 1.
Figure 1.
Immunoblot of HDL-associated proteins confirms LC-MS/MS results. To confirm the results obtained by LC-MS/MS, HDL isolated from hemodialysis patients and control subjects was subjected to immunoblot analysis. HDL-associated proteins were separated by SDS-PAGE, transferred to PVDF membranes, and probed using specific antibodies. Molecular mass is indicated on the right.
Figure 2.
Figure 2.
Uremia impairs cholesterol efflux capability of HDL. HDL from 27 hemodialysis patients (HD) and 19 control subjects (CON) were examined for their ability to efflux [3H]cholesterol from TO-901317-stimulated lipid-loaded RAW267 macrophages. (A) [3H]cholesterol-labeled cells were incubated with HDL (50 μg/ml) for 2 hours at 37°C. Cholesterol efflux is expressed as radioactivity in the medium relative to total radioactivity in medium and cells. The values shown represent the means of three individual experiments performed in duplicates. (B) To determine SR-BI-mediated efflux, [3H]cholesterol-labeled ldlA7[SR-BI] cells and control ldlA7 cells were incubated with HDL (100 μg/ml) for 2 hours at 37°C. The difference in efflux between control and SR-BI-overexpressing cells was taken as a measure of SR-BI-mediated efflux. The values shown represent the means of two individual experiments performed in triplicates. (C) To assess ABCA1-specific efflux, [3H]cholesterol RAW267 macrophages were stimulated with cAMP and incubated in the presence of 20 μg/ml HDL for 3 hours. ABCA1-specific efflux to HDL was determined by subtracting cholesterol efflux in presence of probucol (ABCA1 inhibitor) from efflux in absence of the inhibitor. (D) To assess net cholesterol flux, RAW267 macrophages were cholesterol-loaded as described in the Concise Methods section. Cellular cholesterol flux was initiated by exposure of cells to serum-free medium with or without HDL (100 μg/ml) for 14 hours. Afterwards cellular lipids were extracted, and total cholesterol mass/mg cell protein was determined. For ABCA1-specific efflux (C) and net cholesterol flux (D), pooled HDL fractions of HD patients and controls were used. The results represent the means of triplicate determinations ± SD of two experiments. Statistical analysis was performed by t test for two groups and with ANOVA for more than two groups. Significances were accepted at *P < 0.05, **P < 0.01, and ***P < 0.001.
Figure 3.
Figure 3.
Determinants of cholesterol efflux potential of HDL. To determine factors influencing HDL cholesterol efflux potential, proteomic data were correlated with [3H]cholesterol efflux capability of HDL preparations from patients and controls. (A) Positive correlation of apoA-I and apoA-II with [3H]cholesterol efflux. (B) Negative correlation of HDL-SAA1, HDL-albumin, and HDL-apoC-III with [3H]cholesterol efflux. (C) Correlations of phospholipid and triglyceride content of HDL with the [3H]cholesterol efflux. Pearson's correlation coefficients are noted for each plot. **P < 0.01. PL, phospholipids; TG, triglycerides.
Figure 4.
Figure 4.
SAA1, albumin, and apoC-III replace the HDL apolipoproteins apoA-I and apoA-II. ApoA-I and apoA-II content of HDL from patients and controls was correlated with HDL-SAA1 (A), HDL-albumin (B), and HDL-apoC-III (C) content. Pearson's correlation coefficients are noted for each plot. **P < 0.01; *P < 0.05.
Figure 5.
Figure 5.
Increased content of Lp-PLA2 correlates with reduced HDL-phospholipid content and cholesterol efflux capability. (A) Negative correlation between the HDL-Lp-PLA2 mass and HDL phospholipids. (B) Negative correlation between HDL-Lp-PLA2 mass and HDL-mediated [3H]cholesterol efflux capability. (C) Positive correlation between HDL-Lp-PLA2 mass and HDL-Lp-PLA2 activity. (D) Positive correlation of HDL-Lp-PLA2 activity and lyso-PC content of HDL. (E) Positive correlation of HDL-apoC-III with HDL triglycerides. Pearson's correlation coefficients are noted for each plot. *P < 0.05; **P < 0.01.
Figure 6.
Figure 6.
PLA2 treatment reduces cholesterol efflux capacity of HDL. Control HDL was PLA2-treated or enriched with lyso-PC (LPC) as described in the Concise Methods section and analyzed for their phospholipid content (A), lysophospholipid content (B), and [3H]cholesterol efflux capability (C). Statistical analysis was performed by ANOVA. Significances were accepted at *P < 0.05, **P < 0.01, and ***P < 0.001.
Figure 7.
Figure 7.
Schematic illustration of HDL remodeling in uremic patients. HDL from uremic hemodialysis patients exhibits various alterations in the proteome and lipid composition that are linked to impaired cholesterol acceptor capacity. Uremic HDL is significantly enriched in SAA1, albumin, and apoC-III, as well as in the low-abundant HDL-associated proteins apoA-IV, RBP4, transthyretin (TTR), antitrypsin, and Lp-PLA2. These proteomic alterations were accompanied by the loss of apoA-I and apoA-II. In addition, uremia and dialysis lead to profound alterations in HDL-lipid composition reflected as a decrease in phospholipids (PL) and free cholesterol (FC) and an increase in triglyceride (TG) and lyso-PC (LPC) content.

References

    1. Go AS, Chertow GM, Fan D, McCulloch CE, Hsu CY: Chronic kidney disease and the risks of death, cardiovascular events, and hospitalization. N Engl J Med 351: 1296–1305, 2004 - PubMed
    1. Stenvinkel P: Chronic kidney disease: A public health priority and harbinger of premature cardiovascular disease. J Intern Med 268: 456–467, 2010 - PubMed
    1. Himmelfarb J, Stenvinkel P, Ikizler TA, Hakim RM: The elephant in uremia: Oxidant stress as a unifying concept of cardiovascular disease in uremia. Kidney Int 62: 1524–1538, 2002 - PubMed
    1. Stenvinkel P: Interactions between inflammation, oxidative stress, and endothelial dysfunction in end-stage renal disease. J Ren Nutr 13: 144–148, 2003 - PubMed
    1. Barter PJ, Nicholls S, Rye KA, Anantharamaiah GM, Navab M, Fogelman AM: Antiinflammatory properties of HDL. Circ Res 95: 764–772, 2004 - PubMed

Publication types

MeSH terms