. 2011 Sep;121(9):3479-91.
doi: 10.1172/JCI43428. Epub 2011 Aug 1.

Disruption of the histone acetyltransferase MYST4 leads to a Noonan syndrome-like phenotype and hyperactivated MAPK signaling in humans and mice

Affiliations

Disruption of the histone acetyltransferase MYST4 leads to a Noonan syndrome-like phenotype and hyperactivated MAPK signaling in humans and mice

Michael Kraft et al. J Clin Invest. 2011 Sep.

Abstract

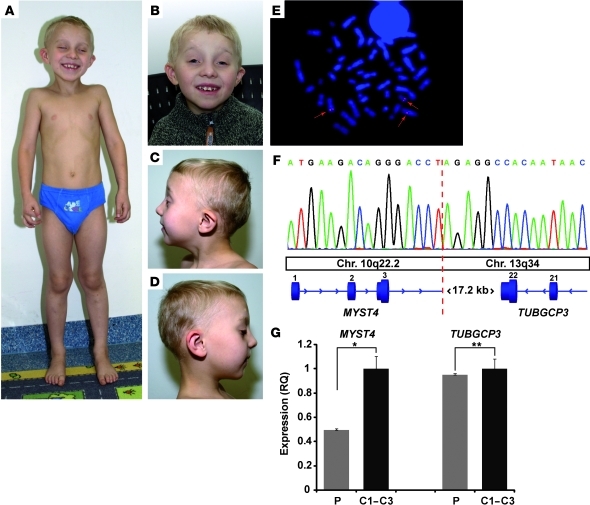
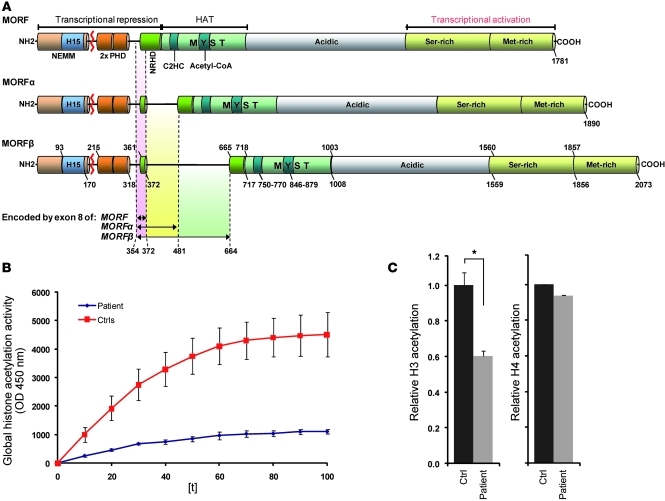
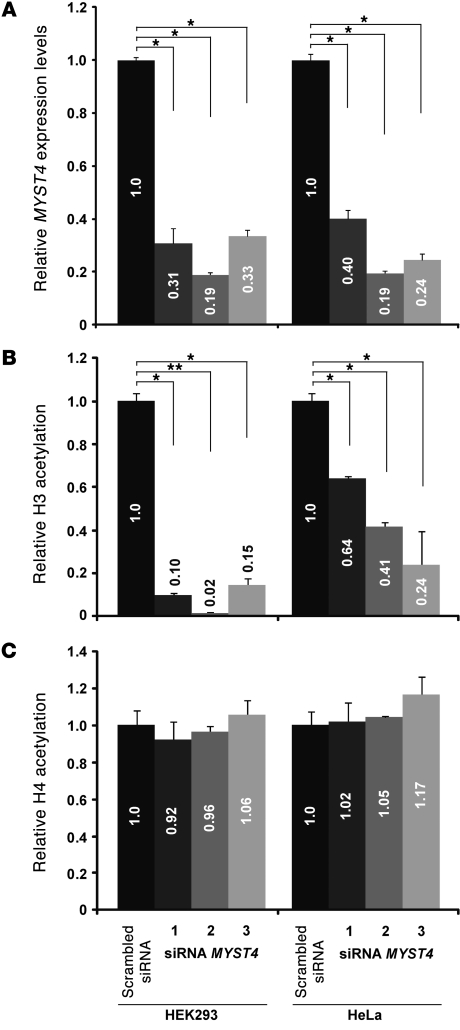
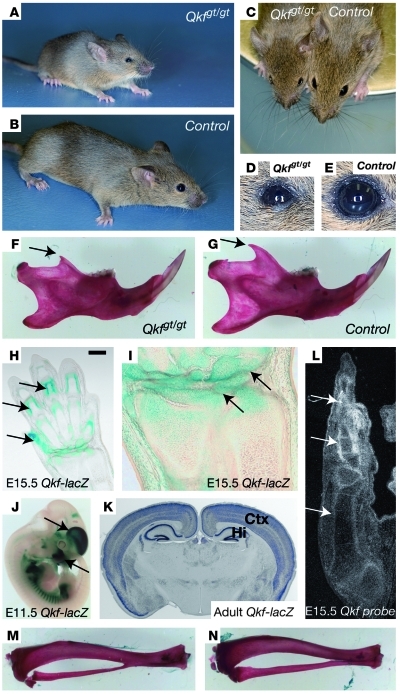
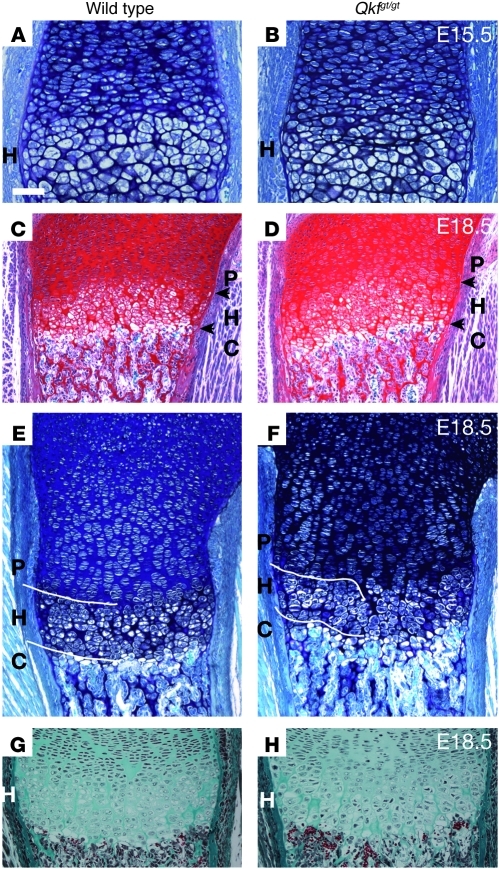
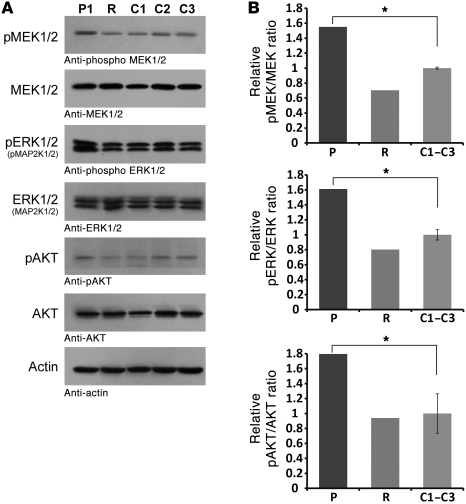
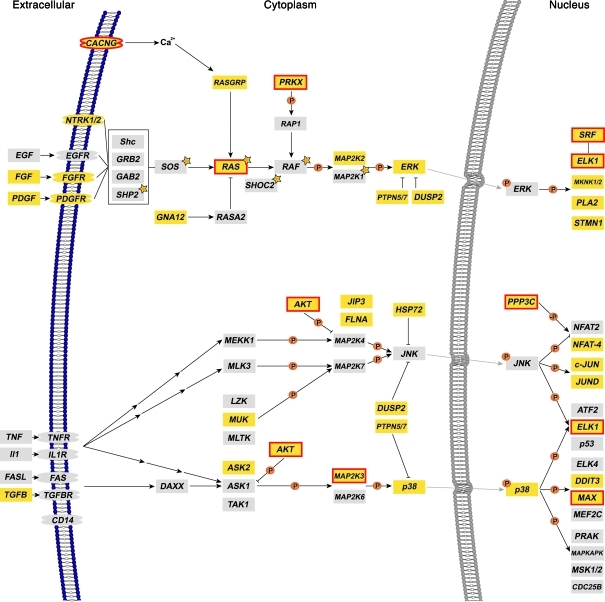
Epigenetic regulation of gene expression, through covalent modification of histones, is a key process controlling growth and development. Accordingly, the transcription factors regulating these processes are important targets of genetic diseases. However, surprisingly little is known about the relationship between aberrant epigenetic states, the cellular process affected, and their phenotypic consequences. By chromosomal breakpoint mapping in a patient with a Noonan syndrome-like phenotype that encompassed short stature, blepharoptosis, and attention deficit hyperactivity disorder, we identified haploinsufficiency of the histone acetyltransferase gene MYST histone acetyltransferase (monocytic leukemia) 4 (MYST4), as the underlying cause of the phenotype. Using acetylation, whole genome expression, and ChIP studies in cells from the patient, cell lines in which MYST4 expression was knocked down using siRNA, and the Myst4 querkopf mouse, we found that H3 acetylation is important for neural, craniofacial, and skeletal morphogenesis, mainly through its ability to specifically regulating the MAPK signaling pathway. This finding further elucidates the complex role of histone modifications in mammalian development and adds what we believe to be a new mechanism to the pathogenic phenotypes resulting from misregulation of the RAS signaling pathway.


Figures

Figure 1
Figure 1. Phenotype and genetic studies in the patient with MYST4 haploinsufficiency at age 6 years.
(A) Note the mild funnel chest and the genua valga and facial dysmorphism (BD) with blepharophimosis, ptosis, high arched eyebrows, low-set ears, smooth philtrum, and retrognathia and a high arched palate. Ptosis was surgically treated at age 5 and 6 years. (E) Representative metaphase spread of the patient using the BAC clone RP11-668A2 (red, arrows), with hybridization signals localized on both derivative chromosomes, spanning the breakpoint region. Original magnification, ×1,000. (F) Breakpoint sequencing after long-range PCR indicating the breakpoint (red dotted line) disrupting the MYST4 gene in intron 3. Chr., chromosome. (G) Relative mRNA expression levels of the haploinsufficient MYST4 gene and the TUBGCP3 gene 3′ of the breakpoint region in the peripheral blood of the patient (P) and 3 healthy age-matched controls (C1–C3). Note the significant decrease of MYST4 expression levels in the patient (*P < 0.001, t test) but unchanged relative expression levels of TUBGCP3 (**P < 0.8, t test). RQ, relative quantification.
Figure 2
Figure 2. Structure and histone acetylation of MYST4.
(A) Three MYST4 isoforms have been identified (MORF, MORFα, and MORFβ) to differ in the negative regulator for HAT domain (NRHD) coded by exon 8. The red line indicates the site of translocation (exon 3/4 boundary at amino acid position 207) with respect to protein structure. Note histones H1- and H5-like domain (H15), C4HC3 PHD-zinc fingers (PHD), and the N-terminal part of Enok, MOZ, or MORF (NEMM). Numbers represent amino acids. NH2, N-terminal end of the protein; 2x PHD, 2-times PHD domain; C2HC, zinc finger motif domain. (B) Time course of histone acetylation activity in a cell line of the patient compared with that of controls (Ctrls). (C) Significant decrease of global H3 (*P < 0.05, t test) but normal H4 acetylation in the patient (t test).
Figure 3
Figure 3. Effect of different MYST4 siRNAs on H3 and H4 acetylation.
(A) Results of quantitative RT-PCR revealed significantly reduced MYST4 mRNA expression levels in both cell lines (*P < 0.05, t test), HEK293 and HeLa, after exposure to 3 different MYST4 siRNAs (1, HSS118879; 2, HSS118880; 3, HSS118881). (B) Significant decrease of global H3 but (C) normal H4 acetylation was confirmed in HEK293 and HeLa cell lines (*P < 0.05, t test; **P < 0.00001, t test). Note the correlation between MYST4 depletion levels and loss of H3 acetylation (P < 0.02793, rank correlation coefficient) but not H4 acetylation (P < 0.9349, rank correlation coefficient). Based on these results the siRNA HSS118880 was used for further analysis. Numbers in the bars are the relative quantification.
Figure 4
Figure 4. Qkfgt/gt mutant mice deficient in Myst4.
Qkfgt/gt mutant mice deficient in MYST4 exhibit facial and skeletal abnormalities. (AC) External appearance of Qkfgt/gt mutant mice versus that of controls at 7 weeks of age. (D and E) Close-up images of the eyes. (F and G) Skeletal preparation of the lower jaw. (HK) β-Galactosidase reporter activity (blue) representing the high Qkf gene expression domains (H and I) in cartilage primordia of the developing skeletal system at E15.5, (J) primordia of the cerebral cortex and skeletal elements at E12.5, and (K) the adult parietal cortex (Ctx) and hippocampus (Hi). (L) Endogenous Qkf mRNA detected by in situ hybridization in skeletal primordia of the E15.5 hind limb (precipitated silver grains corresponding to Qkf mRNA appear white in dark-field image). Arrows indicate coronoid process in F and G, strongly Qkf–β-galactosidase–positive cells in H and I, telencephalon and mandibular process in J and K, and endogenous Qkf mRNA expressing cells in skeletal primordia in L. (M) In mice, the tibia and the fibula normally fuse in their distal third. (M) The Qkfgt/gt mutant mice lack the fusion of the tibia and fibula (N) normally observed in wild-type mice. Scale bar: 190 μm (H); 65 μm (I); 160 μm (J); 790 μm (K); 910 μm (L); and 3.6 mm (M and N).
Figure 5
Figure 5. Myst4 deficiency alters growth plate in mice.
(A, C, E, and G) Wild-type and (B, D, F, and H) Qkfgt/gt mutant growth plates. (A, B, E, and F) Toluidine blue/fast green, (C and D) safranin O/fast green, and (G and H) Masson’s trichrome–stained sections of (A and B) E15.5 distal femur, (C and D) E18.5 proximal and (EH) distal femur. (A and B) Disorganization in the Qkfgt/gt mutant hypertrophic (H) region was visible at E15.5 and (cf) more pronounced at E18.5 and enlarged in G and H. Arrows delineate the border of the hypertrophic zone. Note the poor demarcation between the Qkfgt/gt proliferative (P), hypertrophic, and chondrolytic (C) regions, as compared with those of wild-type regions, particularly in F versus E (indicated with white lines), the reduced height of the hypertrophic region (167 μm in E versus mean height of 136 μm in F; P value < 0.05), and the aberrant columnar structure in the hypertrophic region (H versus g). Scale bar: 55 μm (A and B); 180 μm (C and D); 95 μm (E and F); and 90 μm (G and H).
Figure 6
Figure 6. Biochemical characterization of MEK, ERK, and AKT phosphorylation levels.
(A) Increased MAPK signaling activity of the patient (P1) containing the MYST4 mutation compared with 3 control samples (C1–C3). The patient cell line transiently transfected with an MYST4 wild-type construct (R) demonstrated a normalization of the phosphorylation levels. Cells were analyzed for the phosphorylation level of MEK/pMEK1/2 (MAP2K/pMAP2K1/2), ERK/pERK1/2, and AKT/pAKT. Total amounts of MEK, ERK, and AKT and actin in cell lysates are shown, and the specificity of the antibody is specified below each panel. (B) After normalization to actin, densitometric analysis confirmed significantly increased ratios of all 3 measured parameters (*P < 0.05, t test) and normalization to wild-type ratios after rescue of MYST4 expression levels.
Figure 7
Figure 7. The MAPK signaling pathway.
Overview of genes with ChIP-CHIP binding sites and differential expression. Three out of the four major branches of the MAPK signaling pathway are shown: ERK1/2 (MAP2K1/2), c-Jun, and p38 (modified from KEGG pathway map 04010; http://www.genome.jp/kegg/). Mutations affecting the ERK1/2 (MAP2K1/2) branch are identified in approximately 70% of patients with Noonan syndrome (genes marked with orange stars). Note that genes with significant ChIP-on-CHIP bindings sites (Supplemental Table 23) are marked in yellow; additional significantly differentially expressed genes in the human cell lines are marked with red boxes.

References

    1. Kornberg RD, Lorch Y. Twenty-five years of the nucleosome, fundamental particle of the eukaryote chromosome. Cell. 1999;98(3):285–294. doi: 10.1016/S0092-8674(00)81958-3. - DOI - PubMed
    1. MacDonald VE, Howe LJ. Histone acetylation: where to go and how to get there. Epigenetics. 2009;4(3):139–143. - PubMed
    1. Ekwall K. Genome-wide analysis of HDAC function. Trends Genet. 2005;21(11):608–615. doi: 10.1016/j.tig.2005.08.009. - DOI - PubMed
    1. Fraga MF, Esteller M. Towards the human cancer epigenome: a first draft of histone modifications. Cell Cycle. 2005;4(10):1377–1381. doi: 10.4161/cc.4.10.2113. - DOI - PubMed
    1. Urdinguio RG, Sanchez-Mut JV, Esteller M. Epigenetic mechanisms in neurological diseases: genes, syndromes, and therapies. Lancet Neurol. 2009;8(11):1056–1072. doi: 10.1016/S1474-4422(09)70262-5. - DOI - PubMed

Publication types

MeSH terms