. 2011 Jul 31;14(9):1189-94.
doi: 10.1038/nn.2882.

A critical period for auditory thalamocortical connectivity

Affiliations

A critical period for auditory thalamocortical connectivity

Tania Rinaldi Barkat et al. Nat Neurosci. .

Abstract

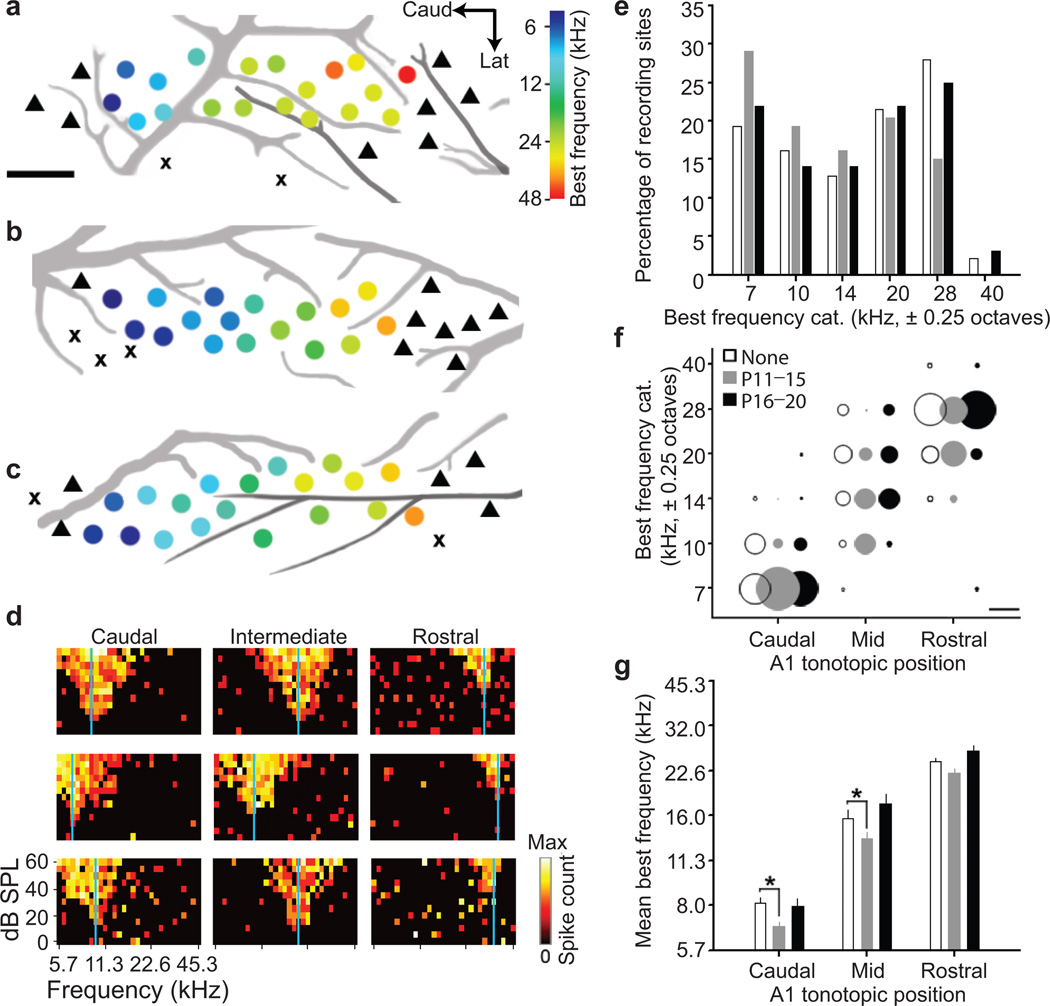
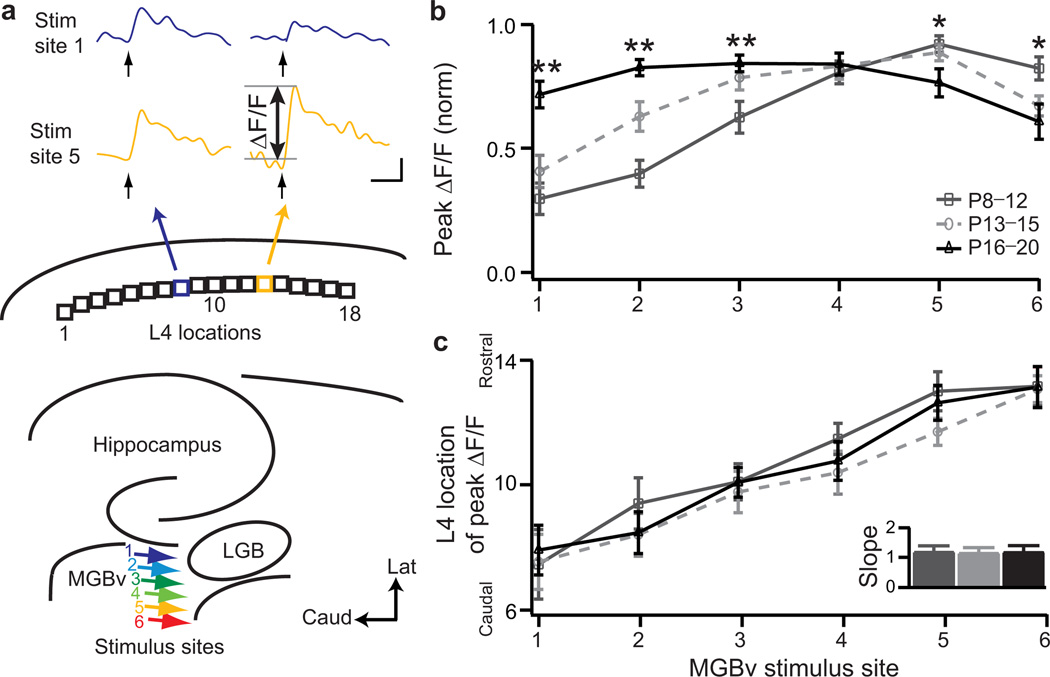
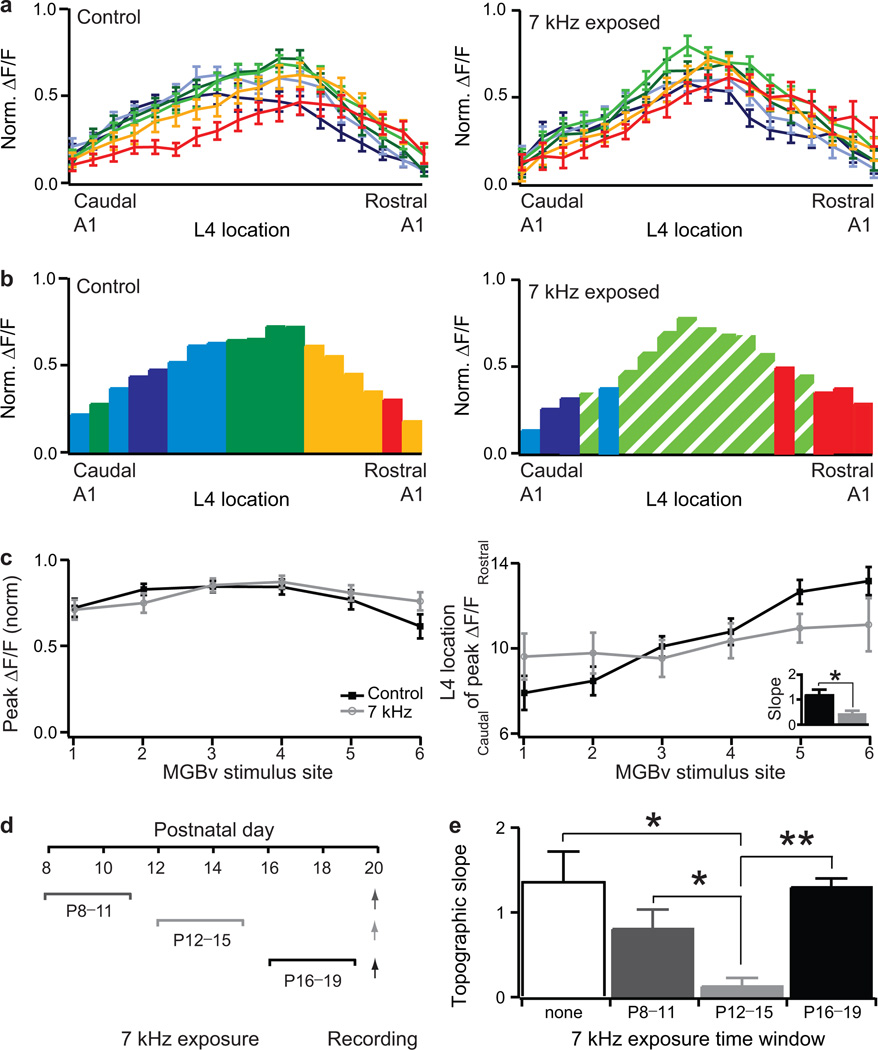
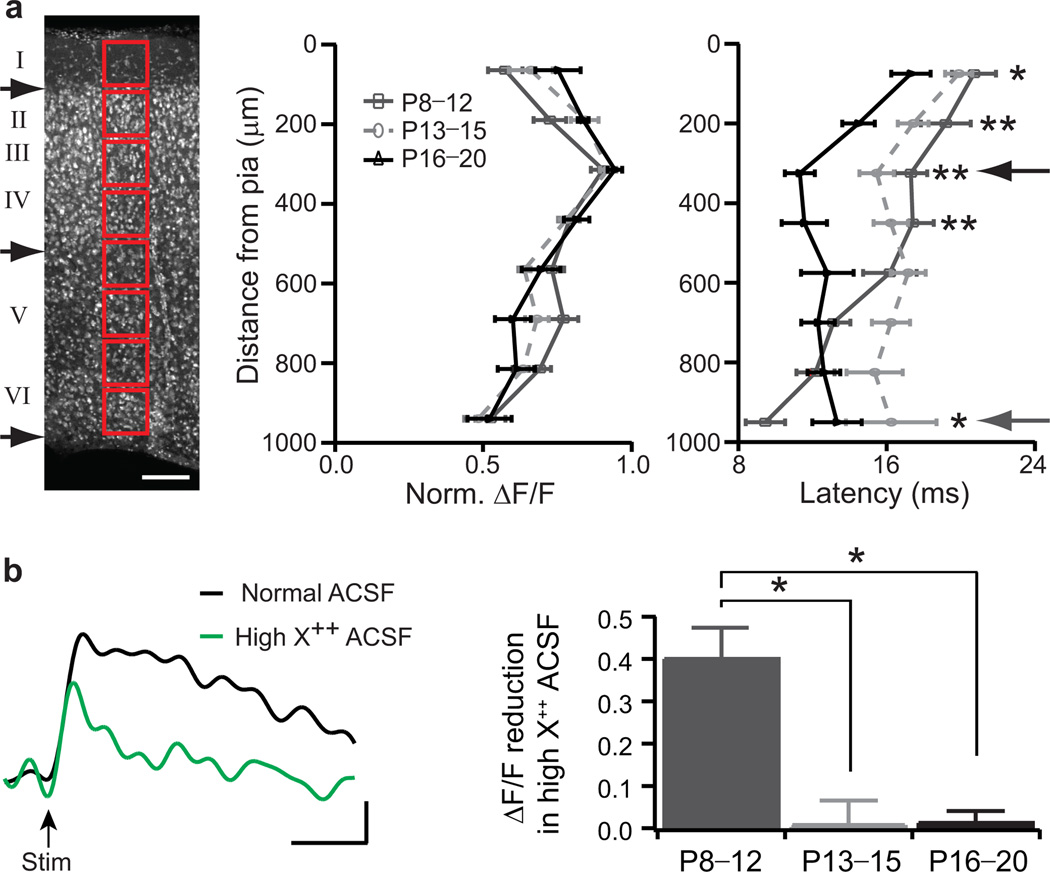
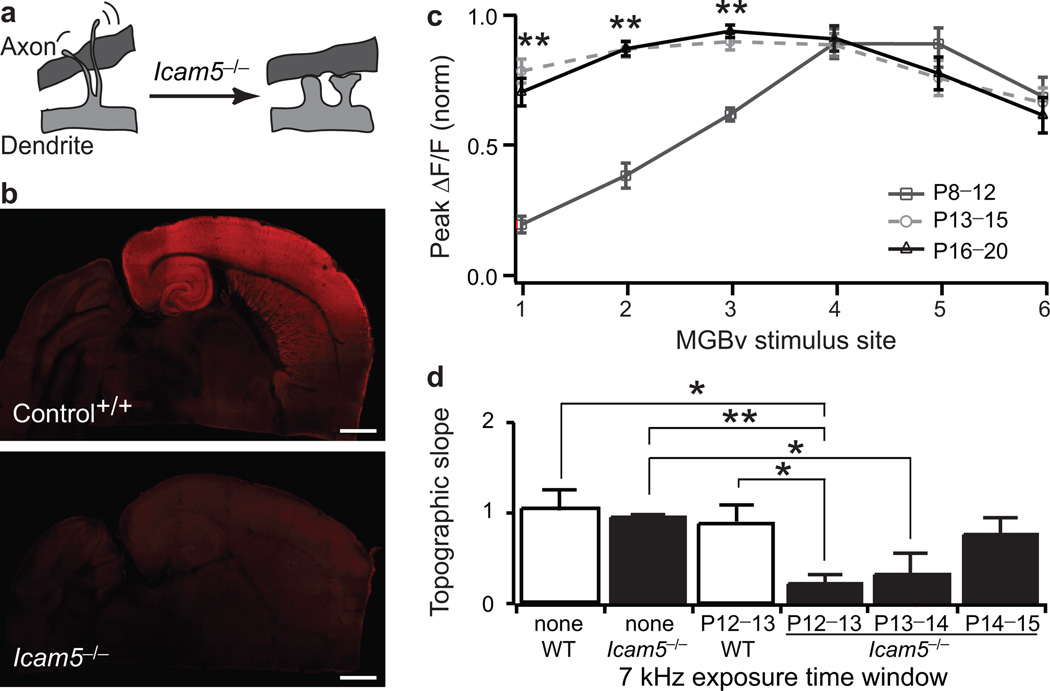
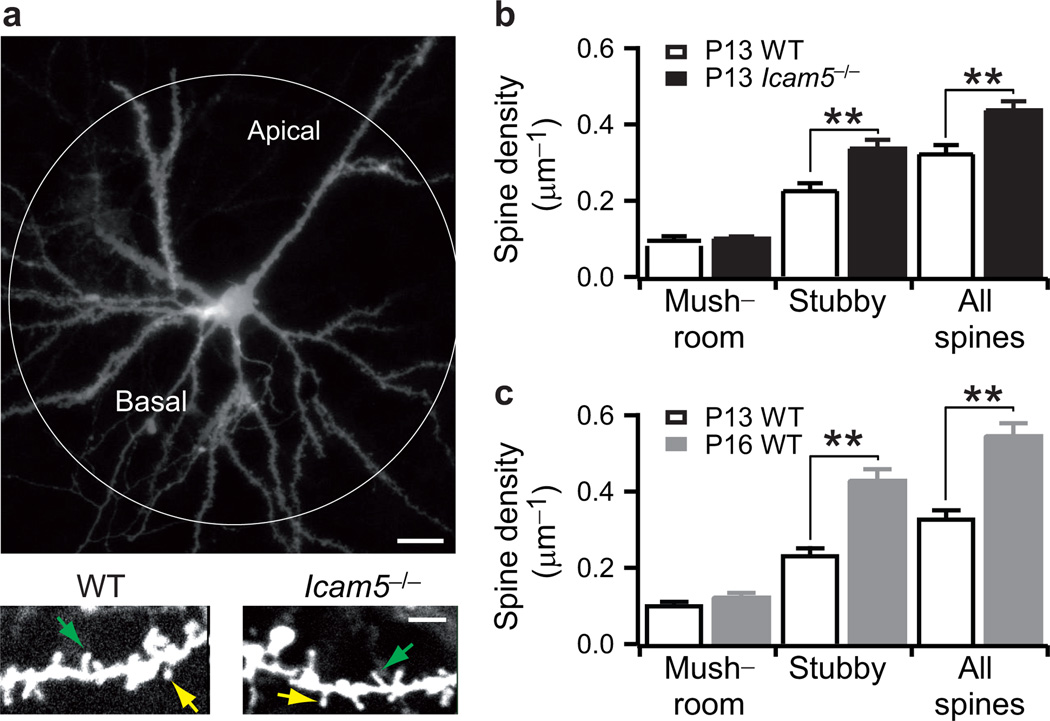
Neural circuits are shaped by experience during periods of heightened brain plasticity in early postnatal life. Exposure to acoustic features produces age-dependent changes through largely unresolved cellular mechanisms and sites of origin. We isolated the refinement of auditory thalamocortical connectivity by in vivo recordings and day-by-day voltage-sensitive dye imaging in an acute brain slice preparation. Passive tone-rearing modified response strength and topography in mouse primary auditory cortex (A1) during a brief, 3-d window, but did not alter tonotopic maps in the thalamus. Gene-targeted deletion of a forebrain-specific cell-adhesion molecule (Icam5) accelerated plasticity in this critical period. Consistent with its normal role of slowing spinogenesis, loss of Icam5 induced precocious stubby spine maturation on pyramidal cell dendrites in neocortical layer 4 (L4), identifying a primary locus of change for the tonotopic plasticity. The evolving postnatal connectivity between thalamus and cortex in the days following hearing onset may therefore determine a critical period for auditory processing.


Figures

Figure 1
Figure 1. Developmental cortical map reorganization in mouse A1
Representative A1 best frequency maps from the left hemisphere of young adult mice (P32–39) reared in a normal sound environment (a) or after 7 kHz tone exposure between P11–P15 (b) or P16–20 (c). Circle denotes multi-unit recording site and hue represents best frequency (color scale). triangle = non-A1 recording site, x = non-responsive site. Scale bar, 0.25 mm. Black and grey lines represent branches of the middle cerebral artery and inferior branches of the rhinal vein, respectively. d, Sample frequency response areas of normalized firing rates as a function of tone frequency and level. Recordings obtained from caudal, intermediate and rostral zones of A1 from mice reared in a normal sound environment (top row), or with 7 kHz tones between P11–P15 (middle row) or P16–P20 (bottom row). Vertical blue line indicates best frequency. e, Percentage of recording sites of all best frequency measurements in normally reared mouse A1 (open bars; n=18,15,12,20,26,2 sites for each of the six categories) or those reared with 7 kHz tones between P11–P15 (grey bars; n=27,18,15,19,14,0 sites) or P16–P20 (black bars, n=14,9,9,14,16,2 sites). Best frequencies are grouped into 0.5 octave bins centered on the X-axis frequency. f, Best frequency distributions segregated by rearing condition and topographic location. Percentage of best frequency sites is represented by circle diameter. Scale bar denotes a diameter equalling 50% of the distribution. g, Best frequency values (mean ± s.e.m.) for each rearing group and topographic position. * P<0.05 (t-test).
Figure 2
Figure 2. Thalamic tonotopy remains stable despite reorganization of A1 maps
a, In vivo recordings from MGBv (grey shading) by a multichannel silicon probe inserted at an angle matching the plane of thalamocortical slices. Inset, schematic depicting position of recording sites relative to cytoarchitectonic boundaries of MGBv. b, Sample frequency response areas recorded from a lateral (left) and medial (right) recording site. All conventions match those in Fig.1d. c, Examples of raw multiunit traces recorded with a tungsten microelectrode used for A1 mapping (upper) or silicon probe used for MGBv mapping (lower). Spikes were registered when signal amplitude exceeded a threshold line set at 4 s.d. from the mean of a 5 sec running average (indicated by grey line). Scale bar, 1 sec, 0.1 mV. d, Images of coronal section through MGBv reacted for cytochrome oxidase. High-power image depicts the location of two lesions made within and outside the MGBv boundary (black outline). Scale bar, 0.5 mm. e, Percentage of recording sites of all best frequency measurements from normally reared mouse MGBv (open bars; n=9,19,10,17,41,5 sites for each of the six categories) and those reared with 7 kHz tones between P11–P15 (grey bars; n=21,21,14,31,50,14 sites). f, Best frequency values (mean ± s.e.m.) measured at lateral (0.05 mm past the lateral MGBv boundary) or medial loci (0.2 mm past the lateral MGBv boundary), as well as averaged overall.
Figure 3
Figure 3. Topography and developmental window for A1 response strengthening at P12–P15
a, Schematic of the six MGBv stimulus sites (colored arrows) and eighteen L4 locations analyzed in A1. Sample traces of ΔF/F at two different L4 loci (8 and 13) as a function of time following a 1 ms stimulus pulse to MGBv site 1 (blue) or 5 (yellow). P12 control mouse. Scale bar, 100 ms, 0.1% ΔF/F. b, Normalized peak ΔF/F as a function of stimulus site for 3 age groups (mean ± s.e.m.; P8–P12, n=13; P13–P15, n=16; P16–P20, n=16). * P<0.05; ** P<0.01 (t-test) between dark grey and black. c, Peak ΔF/F location in L4 as a function of MGBv stimulus site. Inset, topographic slope (mean ± s.e.m.) for the 3 age groups.
Figure 4
Figure 4. Critical period for experience-dependent topographic refinement at P12–P15
a and b, Normalized maximal ΔF/F across L4 loci in response to different MGBv stimulus sites for P16–P20 mice raised in a normal acoustic environment (left panel, n=16) or exposed to a 7 kHz tone from P8 (right panel, n=13). Color code indicates MGBv stimulus site as in Fig.3a. c, Normalized peak ΔF/F, defined as maximum ΔF/F amplitude across all L4 loci, and location of L4 peak ΔF/F in response to different MGBv stimulus site for P16–P20 control and 7 kHz exposed mice. Inset, topographic slopes. (mean ± s.e.m.) * P<0.05 (t-test). d, Schedule of tone exposure windows and recording (arrows). e, Topographic slopes (median ± s.e.m.) for control mice (none, n=9) and those exposed to 7 kHz during three time windows (P8–P11, n=8; P12–P15, n=8; P16–P19, n=5). ** P<0.01 (Mann-Whitney U test).
Figure 5
Figure 5. Columnar shift of thalamocortical connectivity up to L4 through the critical period
a, Nissl stain of a P20 thalamocortical slice for columnar analysis (red boxes). Black arrows denote approximate borders between layers I/II, layers IV/V and layer VI/white matter. Scale bar, 125 µm. Normalized ΔF/F and latency with distance from pia for 3 age groups (mean ± s.e.m.; P8–P12, n=13; P13–P15, n=15; P16–P20, n=11). * P<0.05; ** P<0.01 (t-test) between dark grey and black. b, Sample upper L4 cortical response at P10 in normal (black) and high X++ (green) ACSF. Scale bar, 100 ms, 0.2% ΔF/F. Response reduction (median ± s.e.m.) in high X++ for 3 age groups (P8–P12, n=6; P13–P15, n=8; P16–P20, n=4). * P<0.05 (Mann-Whitney U test).
Figure 6
Figure 6. Forebrain-specific gene deletion accelerates thalamocortical plasticity
a, Icam5 normally slows dendritic spine maturation. b, Icam5 expression at P13 in the auditory thalamocortical slice. Note absence of immunostaining in control MGBv and throughout Icam5−/− brain. Scale bar, 1mm. c, Normalized peak ΔF/F as a function of MGBv stimulus site in Icam5−/− mice for three age groups (median ± s.e.m.; P8–P12, n=8; P13–P15, n=10; P16–P20, n=9). ** P<0.01 (Mann-Whitney U test) between dark grey and black. d, Topographic slope (median ± s.e.m.) for mice without (none, wild-type, n=15; Icam5−/−, n=9) or after 7 kHz exposure between P12–P13 (wild-type, n=9; Icam5−/−, n=7), P13–P14 (Icam5−/−, n=9) or P14–P15 (Icam5−/−, n=9). * P<0.05, ** P<0.01 (Mann-Whitney U test).
Figure 7
Figure 7. Stubby spine density increases through the critical period
a, Sample DiI-labeled upper L4 pyramidal cell. Scale bar, 20 µm (upper panel). High-power image of dendrites at P13 revealing mushroom (yellow arrow) and stubby spines (green arrow). Scale bar, 5 µm (lower panel). b, Spine density in P13 wild-type (n=6) and Icam5−/− mice (n=7 neurons). c, Spine density (median±s.e.m.) in P13 (n=6) and P16 wild-type mice (n=7 neurons). ** P<0.01 (Mann-Whitney U test).

References

    1. Hensch TK. Critical period regulation. Annu Rev Neurosci. 2004;27:549–579. - PubMed
    1. Keuroghlian AS, Knudsen EI. Adaptive auditory plasticity in developing and adult animals. Prog Neurobiol. 2007;82:109–121. - PubMed
    1. Werker JF, Tees RC. Speech perception as a window for understanding plasticity and commitment in language systems of the brain. Dev Psychobiol. 2005;46:233–251. - PubMed
    1. Sanes DH, Bao S. Tuning up the developing auditory CNS. Curr Opin Neurobiol. 2009;19:188–199. - PMC - PubMed
    1. de Villers-Sidani E, Chang EF, Bao S, Merzenich MM. Critical period window for spectral tuning defined in the primary auditory cortex (A1) in the rat. J Neurosci. 2007;27:180–189. - PMC - PubMed

Publication types

LinkOut - more resources