. 2011 Jul 31;43(9):869-74.
doi: 10.1038/ng.890.

Phosphoglycerate dehydrogenase diverts glycolytic flux and contributes to oncogenesis

Affiliations

Phosphoglycerate dehydrogenase diverts glycolytic flux and contributes to oncogenesis

Jason W Locasale et al. Nat Genet. .

Abstract

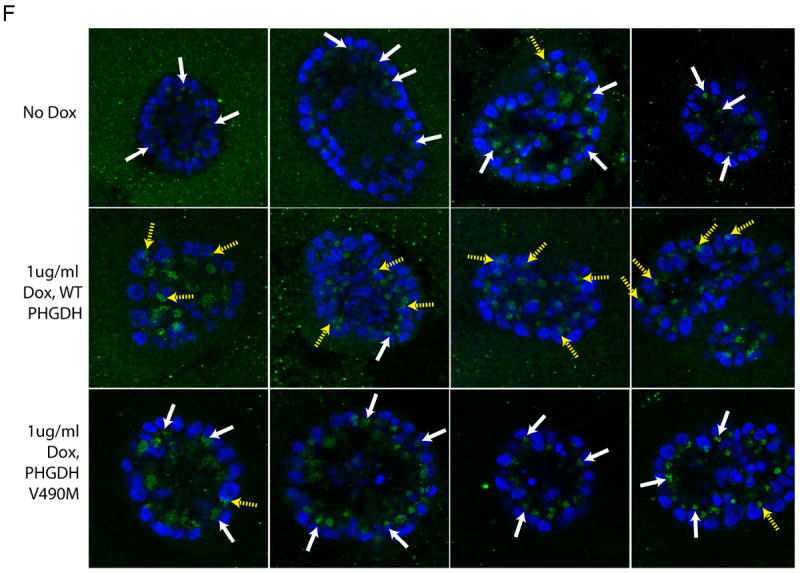
Most tumors exhibit increased glucose metabolism to lactate, however, the extent to which glucose-derived metabolic fluxes are used for alternative processes is poorly understood. Using a metabolomics approach with isotope labeling, we found that in some cancer cells a relatively large amount of glycolytic carbon is diverted into serine and glycine metabolism through phosphoglycerate dehydrogenase (PHGDH). An analysis of human cancers showed that PHGDH is recurrently amplified in a genomic region of focal copy number gain most commonly found in melanoma. Decreasing PHGDH expression impaired proliferation in amplified cell lines. Increased expression was also associated with breast cancer subtypes, and ectopic expression of PHGDH in mammary epithelial cells disrupted acinar morphogenesis and induced other phenotypic alterations that may predispose cells to transformation. Our findings show that the diversion of glycolytic flux into a specific alternate pathway can be selected during tumor development and may contribute to the pathogenesis of human cancer.


Figures

Figure 1
Figure 1. Observation of glycolytic metabolism being diverted into serine and glycine metabolism
a.) Spectral bins of [1H, 13C] HSQC NMR of [U-13C] glucose-labeled cell extracts sorted by intensity in standard units (z-score). Four highest intensity peaks correspond to metabolites lactate, alanine, and glycine respectively. b.) Relative intensity 13C glycine peak normalized to an internal 50mM DSS standard in HEK293T, H1299, and MCF-lOa cells. c.) Schematic of diversion of glucose metabolism into serine and glycine metabolism at the 3-phosphoglycerate (3PG) step through PHGDH. d.) Time (0, 5,10,15, 30 minutes) courses of U-13C labeling intensities of thirteen metabolites from [U-13C] glucose labeling experiments measured with targeted LC/MS relative to baseline level at time zero. e.) Comparison of 3-phosphoserine (pSER) and phosphoenolpyruvate (PEP) labeling kinetics of [U-13C] glucose relative to baseline level at time zero with targeted LC/MS. f.) Relative glucose flux into serine biosynthesis measured by steady-state labeling of [U-13C] glucose into serine with targeted LC/MS. The fraction of labeled to unlabeled glucose-derived metabolites 13C/(12C+13C) ion intensities (glucose incorporation) is plotted for 12 metabolites. Serine is compared with respect to the glucose-labeled fraction of downstream nucleotides and other nucleotide precursors. g.) Relative protein levels (as determined by western blot analysis) of PHGDH in HEK293T, H1299, and MCF-10a cells with a Beta-actin (Actin) loading control shown below the PHGDH band. Quantitation relative to the levels in MCF-10a cells of the total intensity of the PHGDH band relative to the Actin band is shown above.
Figure 2
Figure 2. PHGDH amplification in human cancers and requirement for proliferation
a.) Global survey of PHGDH copy number intensity across 3131 cancers. (left) Plot significance of amplifications (FDR q-value) along chromosome 1p (from Telomere to Centromere) across 3131 samples. Candidate oncogenes (TP73, MYCL1, and JUN) in three peak regions and corresponding FDR q-values are shown. FDR q-value of PHGDH is shown in the fourth peak region. (middle) Copy number intensity along chromosome 1p of 150 cancers containing highest intensity of PHGDH amplification that illustrates the localized intensity near the region of PHGDH. Blue indicates deleted region, white indicates neutral region and red indicates amplified region. (right) Magnification of 4MB region containing PHGDH. Solid line indicates chromosome position of PHGDH coding region. Ratios of ion intensities (fold change) are plotted. b.) Relative cell numbers of T.T. cells upon knockdown with respect to shGFP of GFP, PHGDH, PSAT, and PSPH. Error bars represent the standard deviation of n =3 independent measurements. (below) Interphase FISH analysis showing PHGDH copy number gain in T.T. cells. The green probe maps to 1p12 and includes the PHGDH coding sequence. The red probe maps to the pericentromeric region of chromosome1 (1p11.2-q11.1). (below) Relative protein levels of PHGDH, PSAT, and PSPH (as determined by western blot analysis) in T.T. cells following expression of an shRNA against GFP (shGFP), PHGDH (shPHGDH), PSAT (shPSAT), and PSPH (shPSPH) respectively. c.) PHGDH protein expression and copy number gain in three representative human tissue samples. (upper) PHGDH expression was assessed in tumor samples using Immunohistochemistry (IHC). Nuclei are shown in blue (hematoxylin) and PHGDH antibody staining is shown in brown (3-3’-Diaminobenzidine [DAB]), (lower) panels contain interphase FISH analysis that was carried out as in Fig 2B in matched samples to assess copy number (green) relative to the pericentromeric probe (red).
Figure 3
Figure 3. Growth dependence of PHGDH expression and altered serine metabolism in PHGDH-amplified human melanoma cells
a.) Growth assay of stable cell lines containing shGFP or shPHGDH in five human melanoma cell line. Three (WM266-3, Malme-3M (Malme), and SkMel-28 (Sk28) contain 1p12 copy number gain and two (GAK, Carney) other melanoma cell lines are considered, (left) Western blot analysis of protein levels of PHGDH and corresponding protein levels of Actin shown as a loading control, (right) Cell numbers for shGFP and shPHGDH normalized to shGFP are plotted for each cell line. Error bars were obtained from the standard deviation of n =3 independent measurements. b.) Relative amount of glucose flux into serine biosynthesis measured by steady-state labeling of [U-13C] glucose into serine with targeted LC/MS. The fraction of labeled to unlabeled glucose-derived serine to total serine, 13C/12C+13C, (serine incorporation) is measured in each of the five cell lines. Error bars were obtained from the standard deviation of n =3 independent measurements. c.) Relative ion intensities of 3-phosphoserine (pSer) in control (shGFP) and knockdown (shPHGDH) cells normalized to intensity in knockdown shGFP cells (pSer/shGFP). Error bars were obtained from the standard deviation of n =3 independent measurements. d.) Scatter plot of the ratio of intensities (fold change), versus p value (student’s t-test) of shPHGDH relative to shGFP in Sk-Me128 cells, e.) Ratio of intensities (fold change) of glycolytic intermediates upon PHGDH knockdown (shPHGDH) relative to (shGFP) in Sk-Me128 cells. Error bars were obtained from propagation of error of the standard deviation from three independent measurements.
Figure 4
Figure 4. Enhanced PHGDH expression in human breast cancer and ectopic expression of PHGDH in ductal morphogenesis
a.) Protein expression of PHGDH by western blot analysis with Actin as loading for three concentration of Doxycycline (0μg/ml, 1μg/ml, 2μg/ml). b.) pSER integrated intensities in −Dox (0μg/ml) and +Dox (1μg/ml). c.) Confocal images of DAPI (Blue), Laminin 5 (Green). Representative images from four acini from MCF-10A cells expressing doxycyline-inducible PHGDH without doxycycline (-Dox) or 1 μg/ml doxycyline (+Dox). d.) Enhanced proliferation in the interior of PHGDH-expressing acini. Representative images from acini from MCF-10A cells expressing doxycyline-inducible PHGDH without doxycycline (No Dox) or 1 μg/ml doxycyline (1 μg/ml Dox). Confocal images of MCF-10A cells under the same conditions as in 4C with DAPI (Blue) and the proliferation marker Ki67 (Red), e.) Quantification of acinar filling for 0 μg/ml, 1 μg/ml, and 2μg/ml Dox. Each acini was scored as filled, mostly filled, mostly clear, and clear. These data are representative of multiple independent measurements, f.) Loss of apical polarity in PHGDH-expressing cells. Confocal images of MCF-10A cells under the same conditions as in 4C with DAPI (Blue) and Golgi Apparatus (Green). Solid, white arrows indicate cells displaying oriented golgi apparatus. Dashed, yellow arrows indicate cells exhibiting loss of polarity. Acini with ectopic expression of wild type, but not mutant V490M, PHGDH commonly display mislocalized golgi apparatus, indicative of a lack of cell polarity.

Comment in

Similar articles

Cited by

References

    1. Warburg O, Posener K, Negelein E. Ueber den Stoffwechsel der Tumoren. Biochemische Zeitschrift. 1924;152:319–344.
    1. Vander Heiden MG, Cantley LC, Thompson CB. Understanding the Warburg effect: the metabolic requirements of cell proliferation. Science. 2009;324:1029–33. - PMC - PubMed
    1. Deberardinis RJ, Lum JJ, Hatzivassiliou G, Thompson CB. The biology of cancer: metabolic reprogramming fuels cell growth and proliferation. Cell Metab. 2008;7:11–20. - PubMed
    1. Christofk HR, Vander Heiden MG, Wu N, Asara JM, Cantley LC. Pyruvate kinase M2 is a phosphotyrosine-binding protein. Nature. 2008;452:181–6. - PubMed
    1. Christofk HR, et al. The M2 splice isoform of pyruvate kinase is important for cancer metabolism and tumour growth. Nature. 2008;452:230–3. - PubMed

Publication types

MeSH terms