. 2011 Feb 28:13:2-16.
doi: 10.1088/1367-2630/13/2/025026.

Measurement of the Exchange Rate of Waters of Hydration in Elastin by 2D T(2)-T(2) Correlation Nuclear Magnetic Resonance Spectroscopy

Affiliations

Measurement of the Exchange Rate of Waters of Hydration in Elastin by 2D T(2)-T(2) Correlation Nuclear Magnetic Resonance Spectroscopy

Cheng Sun et al. New J Phys. .

Abstract

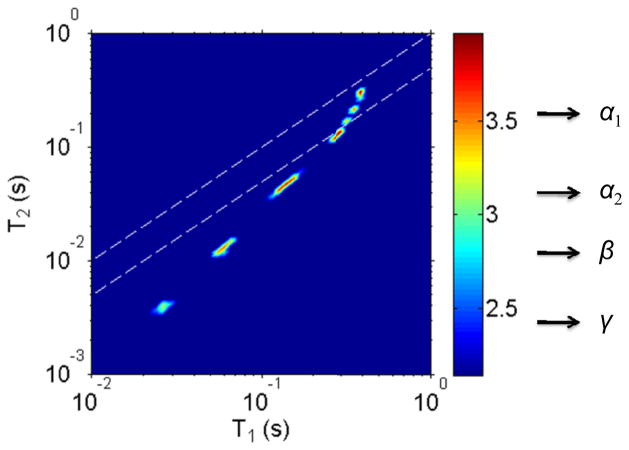
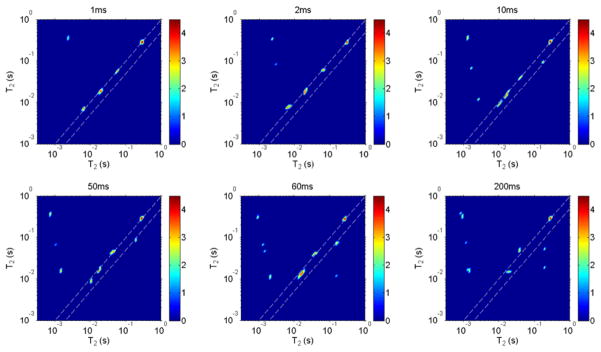
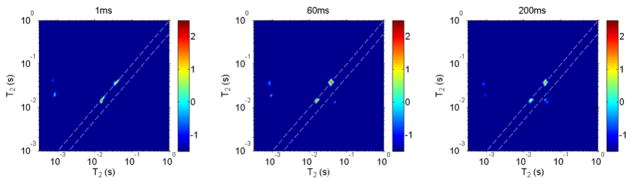
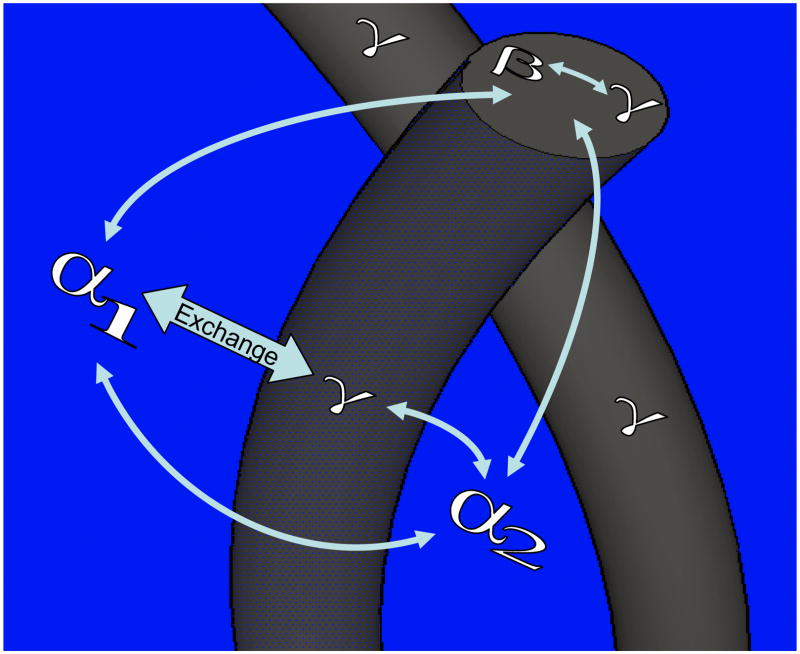
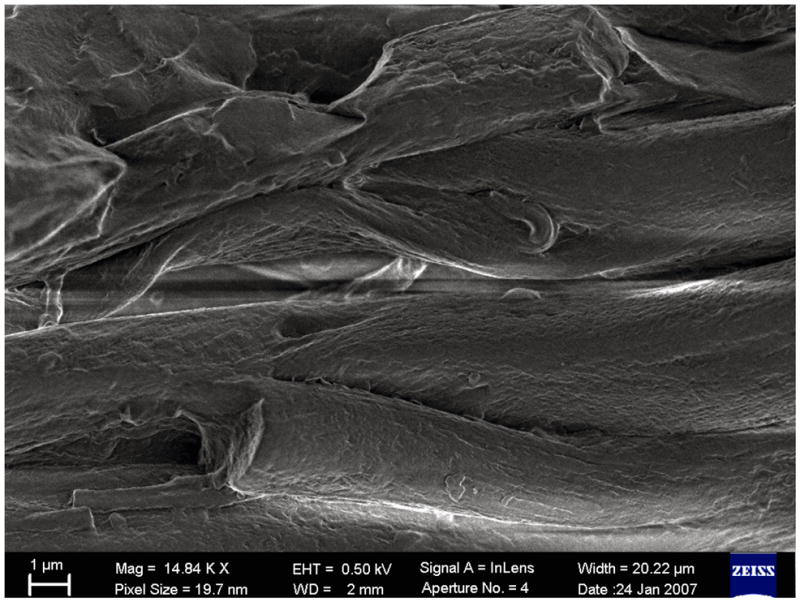
We report on the direct measurement of the exchange rate of waters of hydration in elastin by T(2)-T(2) exchange spectroscopy. The exchange rates in bovine nuchal ligament elastin and aortic elastin at temperatures near, below and at the physiological temperature are reported. Using an Inverse Laplace Transform (ILT) algorithm, we are able to identify four components in the relaxation times. While three of the components are in good agreement with previous measurements that used multi-exponential fitting, the ILT algorithm distinguishes a fourth component having relaxation times close to that of free water and is identified as water between fibers. With the aid of scanning electron microscopy, a model is proposed allowing for the application of a two-site exchange analysis between any two components for the determination of exchange rates between reservoirs. The results of the measurements support a model (described elsewhere [1]) wherein the net entropy of bulk waters of hydration should increase upon increasing temperature in the inverse temperature transition.


Figures

Fig. 1
Fig. 1
RF pulse sequence used for 2D T1-T2 correlation experiments in this work. In the experiments phase cycling was ϕ1 = x, −x, ϕ2 = x, x, −x, −x, ϕ3 = y and the receiver phase was ϕReceiver = x, x, −x, −x. The experimental values for t1 and τ are described in the text.
Fig. 2
Fig. 2
RF pulse sequence used for 2D T2-T2 correlation experiments in this work. The phase cycling used was ϕ1 = x, −x, ϕ2 = y, −y, ϕ3 = x, x, −x, −x and the receiver phase was ϕReceiver = x, −x. The experimental values for tm and τ are described in the text.
Fig. 3
Fig. 3
FIDs in the T1-T2 experiment on NLE at 25°C. In the experiments, t1 was 1 ms, 110 ms and 10s, respectively, as indicated in the figure. The figure illustrates an inversion recovery of magnetization along the t1 dimension, as well as a T2 decay in each FID.
Fig. 4
Fig. 4
A 2D ILT result of the T1-T2 experiment on NLE at 25°C. Four distinguishable peaks are observed, and they are denoted α1, α2, β and γ, respectively. The measured T1app and T2app values are tabulated in Table 1. To guide the eye, the dashed lines in the figure represent the location of T1=T2. The 2D map is shown on a logarithmic scale.
Fig. 5
Fig. 5
2D ILT results of the T2-T2 experiments on AE at 25°C. The figures shows results from when the mixing time was set to tm = 1, 2, 10, 50, 60 and 200 ms, respectively. The figure demonstrates the exchange of water between different compartments in elastin. It is observed that the exchange rates between α1γ, α2γ, βγ and α1α2 are larger than that between α1β. To guide the eye, the dashed lines in the figure represent the location of where T2 in one dimension is equal to T2 of the second dimension. The 2D map is shown on a logarithmic scale.
Fig. 6
Fig. 6
A simulation result using the experimental values of the relaxation times and exchange rates from the T1-T2 and T2-T2 experiments. The mixing time was tm = 1, 60 and 200 ms, respectively. In the simulation, a four-site spin system with exchange was assumed. The T1app and T2app values were used from those tabulated in Table 1. The nine independent elements in the four by four matrix were kα1β =0, kα1γ=15ms1,kα2α1=110ms1, kα2β =0, kα2γ=15ms1,kβα1=1100ms1,kβγ=15ms1, kγα2=0, and kγβ =0. The disagreement with the experimental results in Fig. 5 shows that not all water molecules in the experiments were exchanging, as discussed in detail in the text. To guide the eye, the dashed lines in the figure represent the location of where T2 in one dimension is equal to T2 of the second dimension. The 2D map is shown on a logarithmic scale.
Fig. 7
Fig. 7
A cartoon representing the model proposed for the water/elastin system studied in this work. In the model, four types of waters are distinguishable: α1 and α2 are outside and between elastin fibers, respectively; β is the water that is buried in the fibers; γ is the water that is in closest proximity to the protein backbone. In this model γ can access all other waters — it exists both on the surface of the fiber as well as within the fiber. The component β needs to diffuse outside the fiber via a tortuous channel before it can exchange with α1 or α2. Exchange of water from different reservoirs is indicated by arrows.
Fig. 8
Fig. 8
A SEM image of NLE. The average diameter of elastin fibers was determined to be 3–5 μm. In the image, it is clear that there are spaces between fibers, which accommodate component α2 proposed in Fig. 7.
Fig. 9
Fig. 9
Two typical cross-peak growth curves determined by the mixing time dependence in the T2-T2 experiments. The open points are the experimental data from NLE at 25°C and the solid lines are the fitted curves to Eq.17. The error bars of the experimental data are within 5 percent of the number shown.

Similar articles

Cited by

References

    1. Urry DW, Parker TM. J Muscle Research and Cell Motility. 2002;23:543–559. - PubMed
    1. Lillie MA, Gosline JM. Int J Biol Macromol. 2002;30:119–127. - PubMed
    1. Lillie MA, Gosline JM. Biopolymers. 1995;39:641–652. - PubMed
    1. Lillie MA, Gosline JM. Biopolymers. 1990;29:1147–1160. - PubMed
    1. Mistrali F, Volpin D, Garibaldo GB, Ciferri A. J Phys Chem. 1971;75:142–150. - PubMed

LinkOut - more resources