

Analysis of family- and population-based samples in cohort genome-wide association studies
- PMID: 21805149
- PMCID: PMC3369696
- DOI: 10.1007/s00439-011-1071-0
Analysis of family- and population-based samples in cohort genome-wide association studies
Abstract
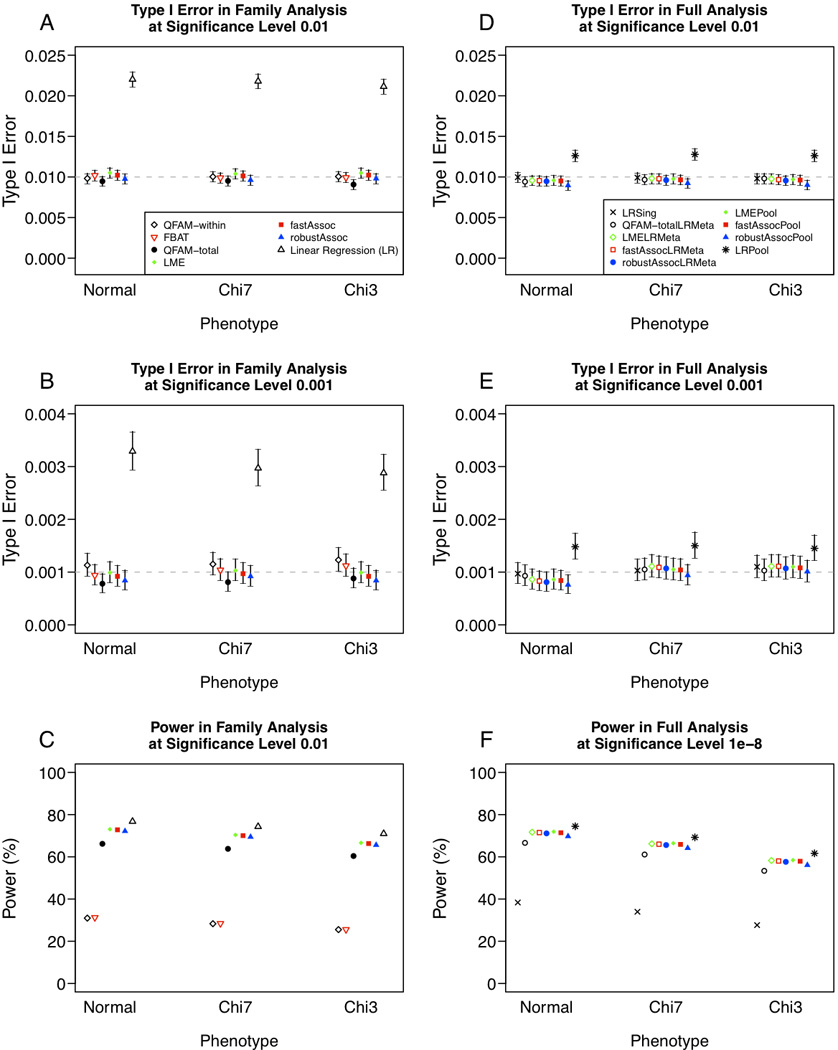
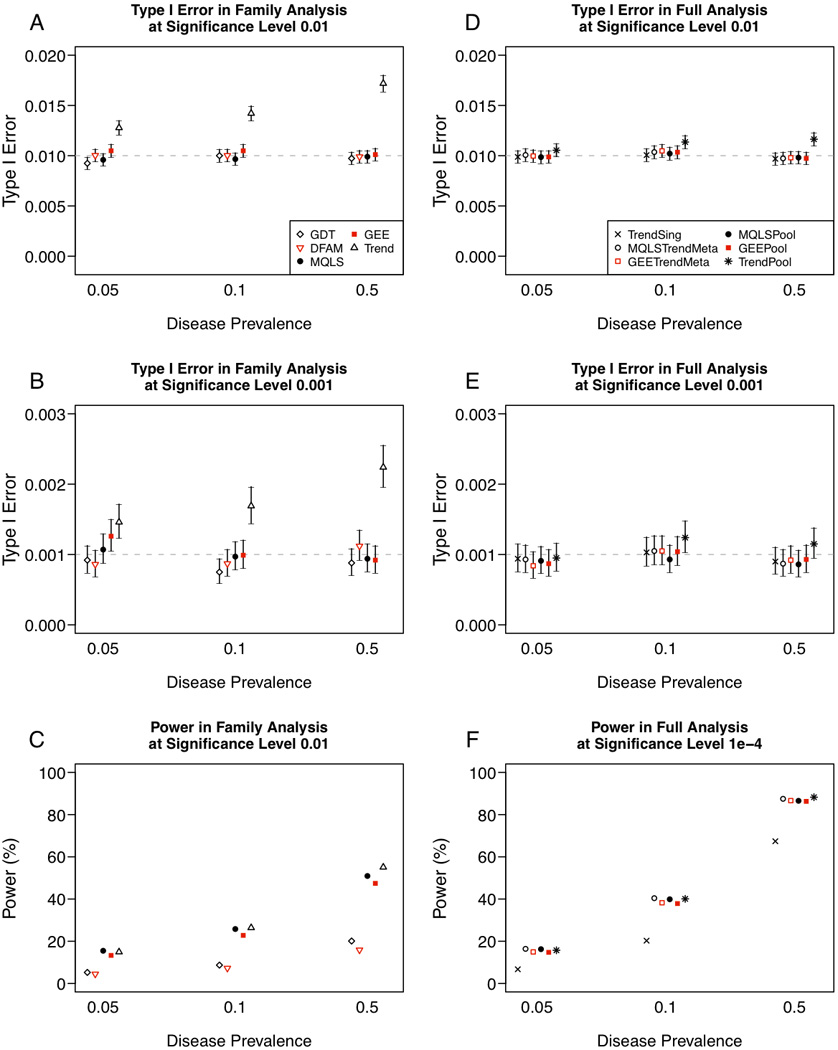
Cohort studies typically sample unrelated individuals from a population, although family members of index cases may also be recruited to investigate shared familial risk factors. Recruitment of family members may be incomplete or ancillary to the main cohort, resulting in a mixed sample of independent family units, including unrelated singletons and multiplex families. Multiple methods are available to perform genome-wide association (GWA) analysis of binary or continuous traits in families, but it is unclear whether methods known to perform well on ascertained pedigrees, sibships, or trios are appropriate in analysis of a mixed unrelated cohort and family sample. We present simulation studies based on Multi-Ethnic Study of Atherosclerosis (MESA) pedigree structures to compare the performance of several popular methods of GWA analysis for both quantitative and dichotomous traits in cohort studies. We evaluate approaches suitable for analysis of families, and combined the best performing methods with population-based samples either by meta-analysis, or by pooled analysis of family- and population-based samples (mega-analysis), comparing type 1 error and power. We further assess practical considerations, such as availability of software and ability to incorporate covariates in statistical modeling, and demonstrate our recommended approaches through quantitative and binary trait analysis of HDL cholesterol (HDL-C) in 2,553 MESA family- and population-based African-American samples. Our results suggest linear modeling approaches that accommodate family-induced phenotypic correlation (e.g., variance-component model for quantitative traits or generalized estimating equations for dichotomous traits) perform best in the context of combined family- and population-based cohort GWAS.
Figures
References
-
- Abecasis GR, Cherny SS, Cookson WO, Cardon LR. Merlin--rapid analysis of dense genetic maps using sparse gene flow trees. Nat Genet. 2002;30:97–101. - PubMed
-
- Agresti A. Categorical data analysis. 2nd edn. New York: Wiley-Interscience; 2002.
-
- American Heart Association. What Your Cholesterol Levels Mean. What Your Levels Mean. 2010;vol 2011 http://www.americanheart.org/presenter.jhtml?identifier=183)
Publication types
MeSH terms
Grants and funding
- N02-HL-6-4278/HL/NHLBI NIH HHS/United States
- R01 HL071251/HL/NHLBI NIH HHS/United States
- R01 HL071259/HL/NHLBI NIH HHS/United States
- RR-024156/RR/NCRR NIH HHS/United States
- N01-HC-95159/HC/NHLBI NIH HHS/United States
- UL1 TR000124/TR/NCATS NIH HHS/United States
- R01HL071205/HL/NHLBI NIH HHS/United States
- N01-HC-95169/HC/NHLBI NIH HHS/United States
- R01 HL071205/HL/NHLBI NIH HHS/United States
- R01HL071259/HL/NHLBI NIH HHS/United States
- R01HL071251/HL/NHLBI NIH HHS/United States
- R01HL071258/HL/NHLBI NIH HHS/United States
- R01HL071250/HL/NHLBI NIH HHS/United States
- N01 HC095169/HL/NHLBI NIH HHS/United States
- R01 HL071252/HL/NHLBI NIH HHS/United States
- R01 HL071250/HL/NHLBI NIH HHS/United States
- UL1 RR024156/RR/NCRR NIH HHS/United States
- R01HL071252/HL/NHLBI NIH HHS/United States
- N01 HC095159/HL/NHLBI NIH HHS/United States
- P30 DK063491/DK/NIDDK NIH HHS/United States
- R01 HL071051/HL/NHLBI NIH HHS/United States
- R01HL071051/HL/NHLBI NIH HHS/United States
- R01 HL071258/HL/NHLBI NIH HHS/United States
LinkOut - more resources
Full Text Sources
Medical
Molecular Biology Databases
