

Links between genetics and pathophysiology in the autism spectrum disorders
- PMID: 21805639
- PMCID: PMC3377085
- DOI: 10.1002/emmm.201100157
Links between genetics and pathophysiology in the autism spectrum disorders
Abstract
Autism spectrum disorders (ASD) are important neuropsychiatric disorders, currently estimated to affect approximately 1% of children, with considerable emotional and financial costs. Significant collaborative effort has been made over the last 15 years in an attempt to unravel the genetic mechanisms underlying these conditions. This has led to important discoveries, both of the roles of specific genes, as well as larger scale chromosomal copy number changes. Here, we summarize some of the latest genetic findings in the field of ASD and attempt to link them with the results of pathophysiological studies to provide an overall picture of at least one of the mechanisms by which ASD may develop.
Copyright © 2011 EMBO Molecular Medicine.
Figures
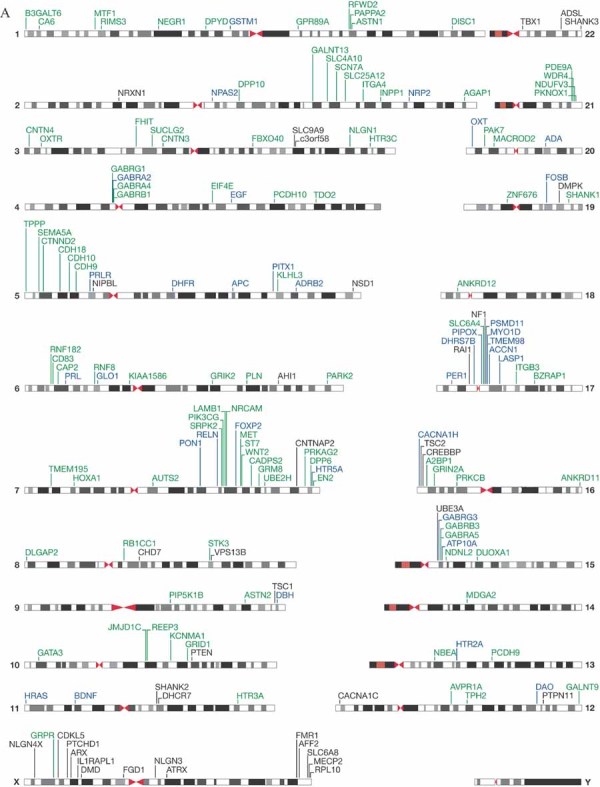
Ideogram showing the relative locations of genes implicated in ASD susceptibility, adapted from the UCSC Genome Browser (
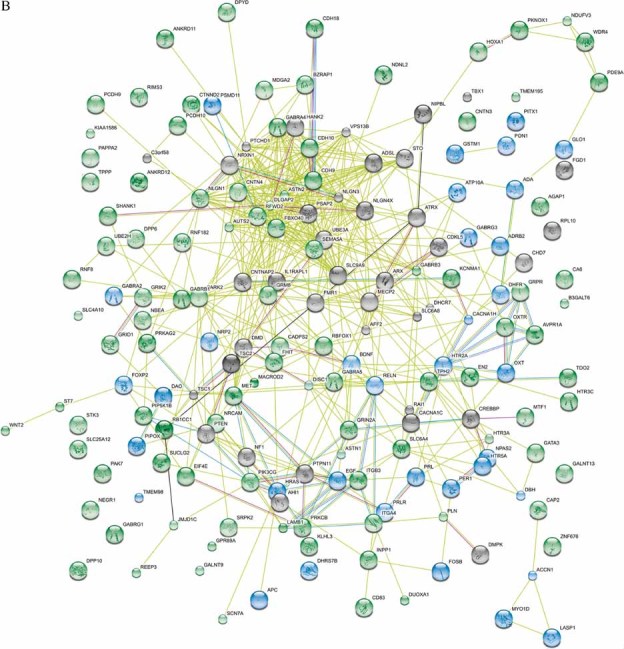
http://genome.ucsc.edu/ ). Genes in black are listed as ‘known ASD genes’ in Pinto et al (2010) Supporting information Table 9. Genes in green are listed as ‘ASD candidates’ in Pinto et al (2010) Supporting information Table 9. Genes in blue are additional genes reported as showing association with ASD (Sousa et al, , Table 2.1).Network of known and predicted interactions between proteins encoded by genes implicated in ASD susceptibility produced by the Search Tool for the Retrieval of Interacting Genes/Proteins (STRING) 9.0 (
http://string.embl.de/ ) using default settings. Proteins are represented by spheres, the colours corresponding to the genes in (A) (protein names may differ from gene names, for example, SHANK3 encodes PSAP2). Lines linking proteins indicate evidence for interactions; pale green = textmining, light blue = databases, pink = experimental, pale purple = homology, black = co-expression, bright green = neighbourhood (the genes reside within 300 bp on the same strand in the genome).
Ideogram showing the relative locations of genes implicated in ASD susceptibility, adapted from the UCSC Genome Browser (
http://genome.ucsc.edu/ ). Genes in black are listed as ‘known ASD genes’ in Pinto et al (2010) Supporting information Table 9. Genes in green are listed as ‘ASD candidates’ in Pinto et al (2010) Supporting information Table 9. Genes in blue are additional genes reported as showing association with ASD (Sousa et al, , Table 2.1).Network of known and predicted interactions between proteins encoded by genes implicated in ASD susceptibility produced by the Search Tool for the Retrieval of Interacting Genes/Proteins (STRING) 9.0 (
http://string.embl.de/ ) using default settings. Proteins are represented by spheres, the colours corresponding to the genes in (A) (protein names may differ from gene names, for example, SHANK3 encodes PSAP2). Lines linking proteins indicate evidence for interactions; pale green = textmining, light blue = databases, pink = experimental, pale purple = homology, black = co-expression, bright green = neighbourhood (the genes reside within 300 bp on the same strand in the genome).
References
-
- Amaral DG, Schumann CM, Nordahl CW. Neuroanatomy of autism. Trends Neurosci. 2008;31:137–145. - PubMed
-
- Anderson GM, Freedman DX, Cohen DJ, Volkmar FR, Hoder EL, McPhedran P, Minderaa RB, Hansen CR, Young JG. Whole blood serotonin in autistic and normal subjects. J Child Psychol Psychiatry. 1987;28:885–900. - PubMed
Publication types
MeSH terms
Grants and funding
LinkOut - more resources
Full Text Sources
