. 2011 Jul;16(7):076002.
doi: 10.1117/1.3594785.

Photoacoustic microscopy of microvascular responses to cortical electrical stimulation

Affiliations

Photoacoustic microscopy of microvascular responses to cortical electrical stimulation

Vassiliy Tsytsarev et al. J Biomed Opt. 2011 Jul.

Abstract

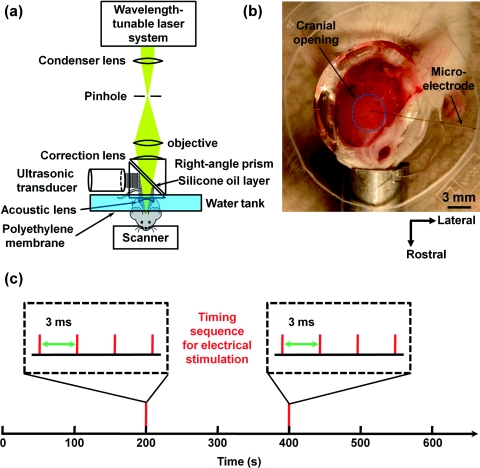
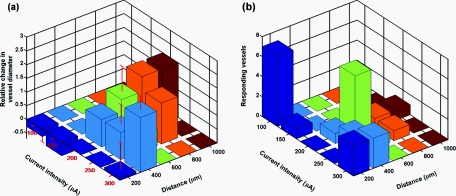
Advances in the functional imaging of cortical hemodynamics have greatly facilitated the understanding of neurovascular coupling. In this study, label-free optical-resolution photoacoustic microscopy (OR-PAM) was used to monitor microvascular responses to direct electrical stimulations of the mouse somatosensory cortex through a cranial opening. The responses appeared in two forms: vasoconstriction and vasodilatation. The transition between these two forms of response was observed in single vessels by varying the stimulation intensity. Marked correlation was found between the current-dependent responses of two daughter vessels bifurcating from the same parent vessel. Statistical analysis of twenty-seven vessels from three different animals further characterized the spatial-temporal features and the current dependence of the microvascular response. Our results demonstrate that OR-PAM is a valuable tool to study neurovascular coupling at the microscopic level.


Figures

Figure 1
Figure 1
(a) Schematic of the optical-resolution photoacoustic microscope. (b) Photograph of the exposed mouse brain surface with an introduced microelectrode. (c) Timing sequence for electrical stimulation.
Figure 2
Figure 2
Superimposed open-skull photoacoustic images of the mouse cortical microvasculature. The maximum-amplitude projection image acquired at 570 nm is shown in gray scale, and the vessel-by-vessel hemoglobin oxygen saturation mapping of a smaller region calculated from dual-wavelength measurements is shown in color scale. B-scan monitoring of the vascular response was performed along the yellow dashed line. V1 and V2 are the two microvessels studied in Fig. 3. (Color online only.)
Figure 3
Figure 3
B-scan monitoring of vasoconstriction and vasodilatation induced by direct electrical stimulations at (a) 100 and (b) 150 μA (B-scan rate is 0.5 Hz). In each panel, the left column is the time course of the change in vessel diameter (represented by the projection of the vessel cross section). The right column is the vessel cross-sectional image at different time points, indicated by the green lines. The red lightning symbol indicates the onset of the stimulation. (Color online only.)
Figure 4
Figure 4
Current-dependent vascular response studied in individual microvessels. (a) Time courses of the diameter change in V1 under various stimulation intensities. (b) and (c) Correlation of the current-dependent vascular responses of two daughter vessels (V1 and V2) bifurcated from the same parent vessel: (b) normalized maximum diameter change and (c) the duration of vasodilatation. The two semi-transparent planes in panel (a) indicate the time points of the two stimuli. (Color online only.)
Figure 5
Figure 5
Spatial characteristics of vasoconstriction and vasodilatation at different stimulation currents studied in 27 microvessels. (a) Relative change in vessel diameter versus distance from the electrode tip. (b) Number of responding vessels versus distance from the electrode tip. For clarification, the relative diameter changes and the numbers of responding vessels are listed in 1(a) and 1(b), respectively.
Video 1
Video 1
Vascular response in individual microvessel. (QuickTime, 9.9 MB)
Figure 6
Figure 6
Temporal characteristics of vasoconstriction (nine vessels) and vasodilatation (15 vessels). The response (rising/falling) time and recovery time of vasodilatation are compared with those of vasoconstriction, using the 1-tailed Wilcoxon signed rank test. The response and recovery times of vasodilatation are statistically significantly longer than those of vasoconstriction (p values for both response and recovery cases are 0.005).

Similar articles

Cited by

References

    1. Allen N. J. and Barres B. A., “Neuroscience: Glia – more than just brain glue,” Nature 457(7230), 675–677 (2009).10.1038/457675a - DOI - PubMed
    1. Inyushin M. Y., Vol'nova A. B., and Lenkov D. N., “Use of a simplified method of optical recording to identify foci of maximal neuron activity in the somatosensory cortex of white rats,” Neurosci. Behav. Physiol. 31(2), 201–205 (2001).10.1023/A:1005272526284 - DOI - PubMed
    1. Frostig R. D., Lieke E. E., Ts'o D. Y., and Grinvald A., “Cortical functional architecture and local coupling between neuronal activity and the microcirculation revealed by in vivo high-resolution optical imaging of intrinsic signals,” Proc. Natl. Acad. Sci. U.S.A. 87(16), 6082–6086 (1990).10.1073/pnas.87.16.6082 - DOI - PMC - PubMed
    1. Uludag K., Dubowitz D. J., Yoder E. J., Restom K., Liu T. T., and Buxton R. B., “Coupling of cerebral blood flow and oxygen consumption during physiological activation and deactivation measured with fMRI,” Neuroimage 23(1), 148–155 (2004).10.1016/j.neuroimage.2004.05.013 - DOI - PubMed
    1. Culver J. P., Durduran T., Furuya D., Cheung C., Greenberg J. H., and Yodh A. G., “Diffuse optical tomography of cerebral blood flow, oxygenation, and metabolism in rat during focal ischemia,” J. Cereb. Blood Flow Metab. 23(8), 911–924 (2003).10.1097/01.WCB.0000076703.71231.BB - DOI - PubMed

Publication types