. 2011 Jul;16(7):076003.
doi: 10.1117/1.3594786.

Label-free oxygen-metabolic photoacoustic microscopy in vivo

Affiliations

Label-free oxygen-metabolic photoacoustic microscopy in vivo

Junjie Yao et al. J Biomed Opt. 2011 Jul.

Abstract

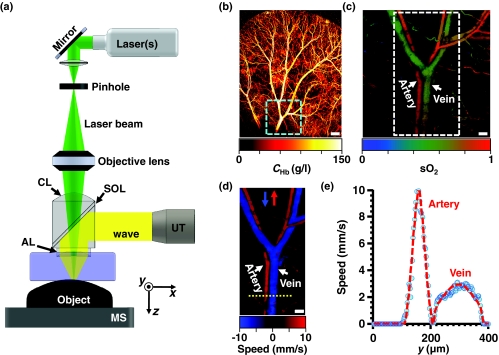
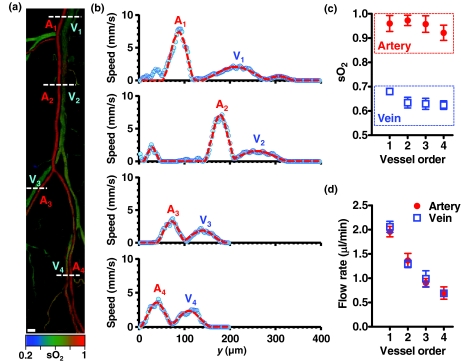
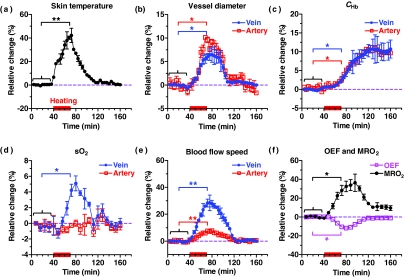
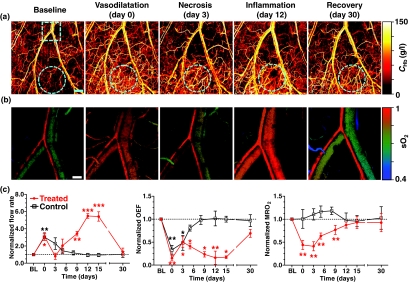
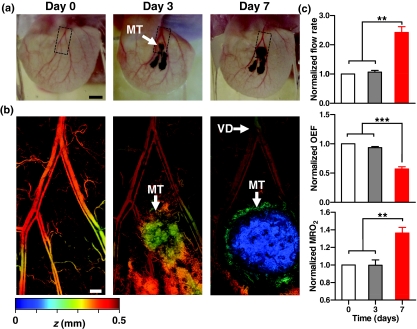
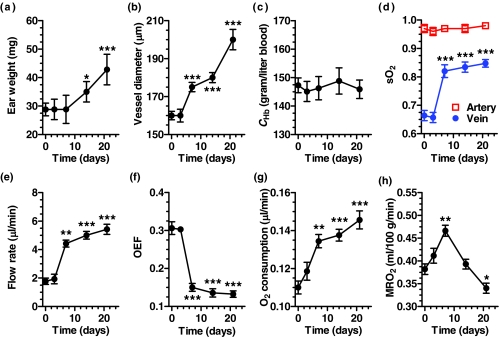
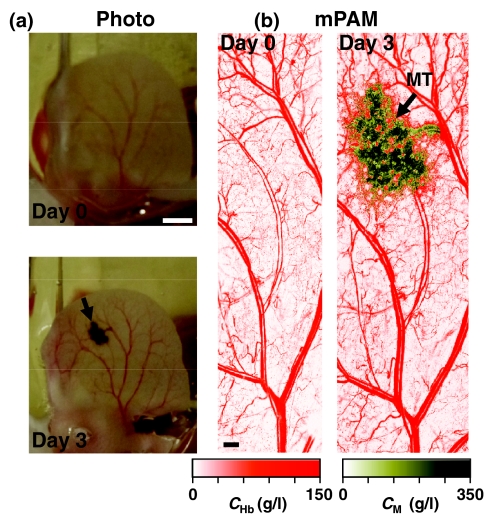
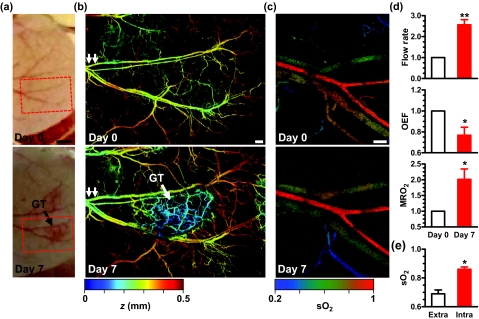
Almost all diseases, especially cancer and diabetes, manifest abnormal oxygen metabolism. Accurately measuring the metabolic rate of oxygen (MRO(2)) can be helpful for fundamental pathophysiological studies, and even early diagnosis and treatment of disease. Current techniques either lack high resolution or rely on exogenous contrast. Here, we propose label-free metabolic photoacoustic microscopy (mPAM) with small vessel resolution to noninvasively quantify MRO(2) in vivo in absolute units. mPAM is the unique modality for simultaneously imaging all five anatomical, chemical, and fluid-dynamic parameters required for such quantification: tissue volume, vessel cross-section, concentration of hemoglobin, oxygen saturation of hemoglobin, and blood flow speed. Hyperthermia, cryotherapy, melanoma, and glioblastoma were longitudinally imaged in vivo. Counterintuitively, increased MRO(2) does not necessarily cause hypoxia or increase oxygen extraction. In fact, early-stage cancer was found to be hyperoxic despite hypermetabolism.


Figures

Figure 1
Figure 1
Label-free quantification of MRO2in vivo. (a) Schematic of mPAM system. Nanosecond laser pulses pass through a pinhole and are focused on the animal's skin surface by an objective. The resultant PA signal is detected by a focused ultrasonic transducer, which is confocally placed with the objective. A transverse resolution of 5 μm and an axial resolution of 15 μm are achieved, with a penetration depth greater than 700 μm. CL: correction lens; AL: acoustic lens; SQL: silicone oil layer; UT: ultrasonic transducer; WT: water tank; MS: motorized scanner. (b) mPAM image of the total concentration of hemoglobin (CHb). Scale bar: 500 μm. (c) mPAM image of the sO2 of hemoglobin in the area indicated by the dashed box in (b). Scale bar: 125 μm. (d) mPAM image of blood flow in the area indicated by the dashed box in (c). Red arrow: positive scanning direction; blue arrow: negative scanning direction. Positive velocity: upward flow. Scale bar: 125 μm. (e) Profile of blood flow speed across the dashed line in (d). (Color online only.)
Figure 2
Figure 2
mPAM measurements of sO2 and blood flow on four orders of artery-vein pairs in the mouse ear. (a) sO2 mapping from two measurements at 584 and 590 nm. Four different orders of artery-vein pairs are labeled. Scale bar: 125 μm. (b) Profiles of blood flow speed across vessels of different orders measured along the dashed lines in (a) on the basis of PA Doppler bandwidth broadening at 584 nm. Generally, the flow speed decreases from the proximal order to the distal order. However, it also depends on the vessel diameter as a result of the conservation of total flow. Solid circles: experimental data; red curves: fit. (c) Mean sO2 versus the vessel order, quantified along the centerline of each vessel. The sO2 values in both the arteries and veins slightly change with the vessel order, especially at distal branches. This is probably due to oxygen diffusion between the arteries and veins, and the inhomogeneous MRO2. (d) Blood flow rate (in μl/min) versus the vessel order, quantified from the flow speed profiles and vessel diameters. Blood flow in both arteries and veins decreases from the proximal order to the distal order and is conserved between the artery and vein of the same order. The blood fed by the artery is mostly drained by the corresponding vein of the same order. V: vein; A: artery. (Color online only.)
Figure 3
Figure 3
mPAM measurement of hemodynamic responses to a hyperthermic challenge (red bars). Relative changes of (a) the skin temperature, (b) vessel diameter, (c) total hemoglobin concentration, (d) sO2, (e) blood flow speed, and (f) OEF and MRO2. Statistics: paired Student's t-test. * p < 0.05, ** p < 0.01, n = 3. Data are presented as means ± s.e.m. The baseline values are (a) temperature: 31.0 ± 0.4 ºC, (b) vessel diameters: 92.5 ± 10.5 μm (vein) and 47.5 ± 8.5 μm (vein), (c) CHb: 146.3 ± 18.1 g/l (vein) and 148.5 ± 14.0 g/l (artery), (d) sO2: 0.70 ± 0.08 (vein) and 0.94 ± 0.04 (artery), (e) flow speeds: 1.3 ± 0.4 mm/s (vein) and 5.1± 0.8 mm/s (artery), and (f) 0.26 ± 0.13 (OEF) and 0.30 ± 0.09 ml/100 g/min (MRO2). (Color online only.)
Figure 4
Figure 4
mPAM monitoring of hemodynamic responses after cryotherapy. (a) mPAM vasculature images acquired in different phases before and after the application of liquid nitrogen. The treated area is indicated by cyan dashed circles. Scale bar: 500 μm. (b) mPAM images of sO2 in the artery-vein pair [cyan dashed box in (a)] that supports the treated area. Scale bar: 125 μm. (c) mPAM quantification of blood flow rate, OEF and MRO2 within 30 days after the treatment. A neighboring area close to the treated region was monitored as a control. Statistics: paired Student's t-test. * p < 0.05, ** p < 0.01, *** p < 0.001, n = 4. Data are presented as means ± s.e.m. Baseline flow rates: 0.72 ± 0.12 μl/min (treated) and 0.44 ± 0.15 μl/min (control); baseline OEF: 0.35 ± 0.04 (treated) and 0.31 ± 0.05 (control); baseline MRO2: 0.30 ± 0.06 ml/100 g/min (treated) and 0.25 ± 0.07 ml/100 g/min (control). BL: baseline. (Color online only.)
Figure 5
Figure 5
mPAM detection of early-stage melanoma by measuring MRO2. (a) White-light photographs of a representative mouse ear before (day 0), three and seven days after the xenotransplantation of B16 melanoma tumor cells. Scale bar: 1 mm. (b) mPAM images of the tumor region [dashed boxes in (a)] at 584 nm. z is coded by colors: blue (superficial) to red (deep). Scale bar: 125 μm. (c) mPAM quantification of blood flow rate, OEF and MRO2 before (day zero), three and seven days after the tumor xenotransplantation, normalized by the values of day zero (flow rate: 1.77 ± 0.50 μl/min; OEF: 0.31 ± 0.04; MRO2: 0.38 ± 0.03 ml/100 g/min). Statistics: paired Student's t-test. ** p < 0.01, *** p < 0.001, n = 5. Data are presented as means ± s.e.m. MT: melanoma tumor; VD: vasodilatation. (Color online only.)
Figure 6
Figure 6
mPAM characterization of melanoma progression. mPAM measurements in absolute units of (a) ear weight, (b) vessel diameter, (c) total hemoglobin concentration, (d) sO2 of hemoglobin, (e) volumetric blood flow rate, (f) OEF, (g) rate of O2 consumption in μl/min, and (h) MRO2 in ml/100 g/min up to 21 days after tumor inoculation. Statistics: paired Student's t-test. * p < 0.05, ** p < 0.01, *** p < 0.001, n = 3. Data are presented as means ± s.e.m.
Figure 7
Figure 7
mPAM differentiation of blood vessels and melanoma. (a) White-light photographs of a representative mouse ear before and three days after the xenotransplantation of B16 melanoma cells. Scale bar: 1 mm. (b) Composite mPAM images of blood vessels (in red) and melanoma (in brown). The two are differentiated by using dual-wavelength excitation at 584 and 605 nm. CHb: total hemoglobin concentration. CM: melanin concentration. Scale bar: 250 μm. MT: melanoma tumor. (Color online only.)
Figure 8
Figure 8
Histological validation of melanoma detection. (a) mPAM image of a mouse ear bearing a B16 melanoma tumor acquired on day seven. z is coded by colors: blue (superficial) to red (deep). Scale bar: 300 μm. (b) Images of H&E stained tissue slices cut approximately across the tumor area (top) and nontumor area (bottom). Scale bar: 150 μm. MT: melanoma tumor. (Color online only.)
Figure 9
Figure 9
mPAM detection of early-stage glioblastoma by measuring MRO2. (a) White-light photographs of a representative mouse ear before (day zero) and seven days after the xenotransplantation of U87 glioblastoma tumor cells. Scale bar: 2 mm. (b) mPAM images of microvasculature in the tumor region [dashed boxes in (a)] at 584 nm. z is coded by colors: blue (superficial) to red (deep). Scale bar: 250 μm. (c) mPAM images of sO2 in the artery-vein pair [double arrows in (b)] that supports the tumor region acquired on day zero and day seven. Scale bar: 100 μm. (d) mPAM quantification of volumetric blood flow rate, OEF and MRO2 seven days after the tumor xenotransplantation, normalized by the values of day zero (flow rate: 1.03 ± 0.41 μl/min; OEF: 0.27 ± 0.03; MRO2: 0.31 ± 0.09 ml/100 g/min). (e) Comparison of the averaged sO2 values in the intra- and extra-tumoral vasculatures. Statistics: paired Student's t-test. * p < 0.05, ** p < 0.01, n = 5. Data are presented as means ± s.e.m. GT: glioblastoma tumor. (Color online only.)
Figure 10
Figure 10
Histological validation of glioblastoma detection. (a) mPAM image of a mouse ear bearing a U87 glioblastoma tumor acquired on day seven. z is coded by colors: blue (superficial) to red (deep). Scale bar: 250 μm. (b) Images of H&E stained tissue slices cut approximately across the tumor (left) and nontumor areas (right). Scale bar: 150 μm. GT: glioblastoma tumor. (Color online only.)

References

    1. Seyfried T. N. and Shelton L. M., “Cancer as a metabolic disease,” Nutr. Metab. 7(7), 1–22 (2010).10.1186/1743-7075-7-7 - DOI - PMC - PubMed
    1. Vaupel P., Kallinowski F., and Okunieff P., “Blood-flow, oxygen and nutrient supply, and metabolic microenvironment of human-tumors – a review,” Cancer Res. 49(23), 6449–6465 (1989). - PubMed
    1. Zhang X. and Le W. D., “Pathological role of hypoxia in Alzheimer's disease,” Exp. Neurol. 223(2), 299–303 (2010).10.1016/j.expneurol.2009.07.033 - DOI - PubMed
    1. Cheng K., Ho K., Stokes R., Scott C., Lau S. M., Hawthorne W. J., O’Connell P. J., Loudovaris T., Kay T. W., Kulkarni R. N., Okada T., Wang X. H. L., Yim S. H., Shah Y., Grey S. T., Biankin A. V., Kench J. G., Laybutt D. R., Gonzalez F. J., Kahn C. R., and Gunton J. E., “Hypoxia-inducible factor-1 alpha regulates beta cell function in mouse and human islets,” J. Clin. Invest. 120(6), 2171–2183 (2010).10.1172/JCI35846 - DOI - PMC - PubMed
    1. Tadros T., Traber D. L., and Herndon D. N., “Hepatic blood flow and oxygen consumption after burn and sepsis,” J. Trauma: Inj., Infect., Crit. Care 49(1), 101–108 (2000).10.1097/00005373-200007000-00016 - DOI - PubMed

Publication types

MeSH terms

Supplementary concepts