

Mitigating effects of vaccination on influenza outbreaks given constraints in stockpile size and daily administration capacity
- PMID: 21806800
- PMCID: PMC3162903
- DOI: 10.1186/1471-2334-11-207
Mitigating effects of vaccination on influenza outbreaks given constraints in stockpile size and daily administration capacity
Abstract
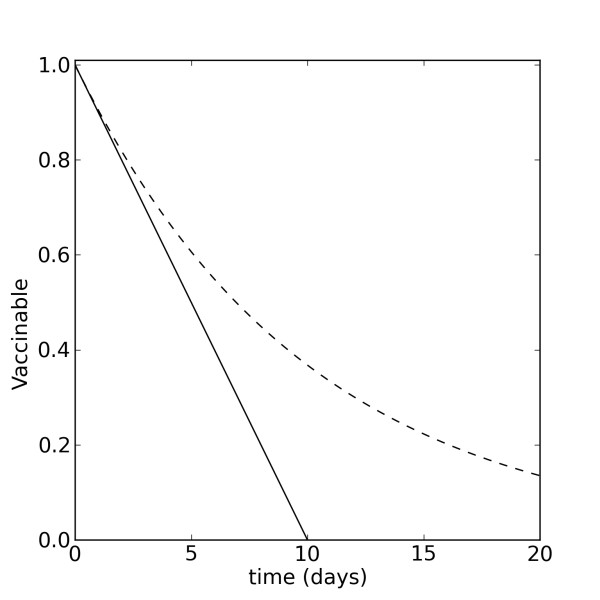
Background: Influenza viruses are a major cause of morbidity and mortality worldwide. Vaccination remains a powerful tool for preventing or mitigating influenza outbreaks. Yet, vaccine supplies and daily administration capacities are limited, even in developed countries. Understanding how such constraints can alter the mitigating effects of vaccination is a crucial part of influenza preparedness plans. Mathematical models provide tools for government and medical officials to assess the impact of different vaccination strategies and plan accordingly. However, many existing models of vaccination employ several questionable assumptions, including a rate of vaccination proportional to the population at each point in time.
Methods: We present a SIR-like model that explicitly takes into account vaccine supply and the number of vaccines administered per day and places data-informed limits on these parameters. We refer to this as the non-proportional model of vaccination and compare it to the proportional scheme typically found in the literature.
Results: The proportional and non-proportional models behave similarly for a few different vaccination scenarios. However, there are parameter regimes involving the vaccination campaign duration and daily supply limit for which the non-proportional model predicts smaller epidemics that peak later, but may last longer, than those of the proportional model. We also use the non-proportional model to predict the mitigating effects of variably timed vaccination campaigns for different levels of vaccination coverage, using specific constraints on daily administration capacity.
Conclusions: The non-proportional model of vaccination is a theoretical improvement that provides more accurate predictions of the mitigating effects of vaccination on influenza outbreaks than the proportional model. In addition, parameters such as vaccine supply and daily administration limit can be easily adjusted to simulate conditions in developed and developing nations with a wide variety of financial and medical resources. Finally, the model can be used by government and medical officials to create customized pandemic preparedness plans based on the supply and administration constraints of specific communities.
Figures
 , where
  .
.
 ).
).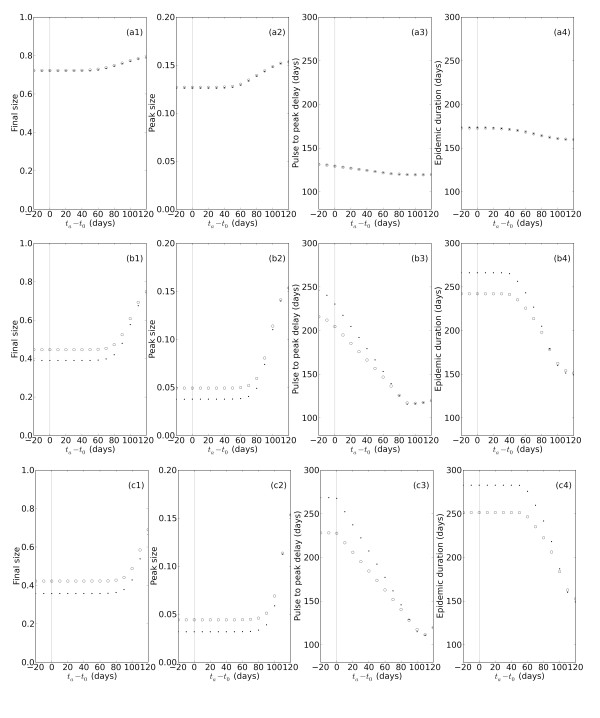
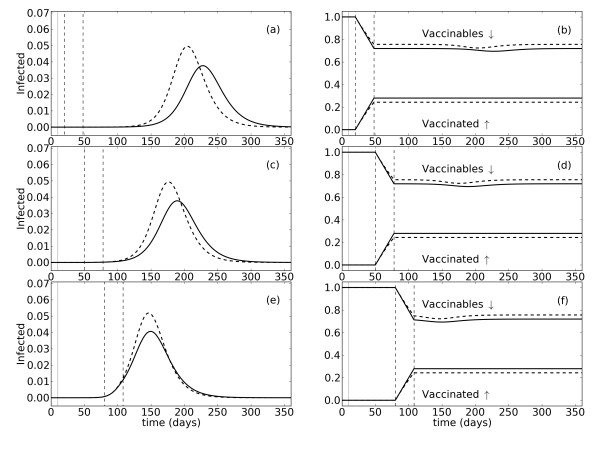
 (non-proportional) (a1-a4), (2) 28 day campaign with k = 0.01 or (b1-b4), and (3) 3 day campaign with k = 0.1 or
  (c1-c4).
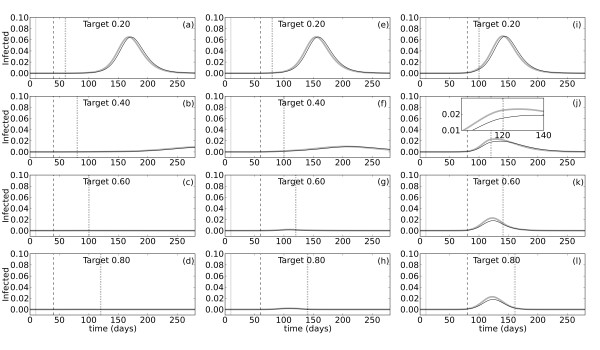 . The pulse inserting infected individual(s) into the susceptible population occurs at t0 = 10 (gray solid vertical lines). The proportion of people infected over time is plotted for vaccination start times, ta = 20 (a-d), ta = 50 (e-h), and ta = 80 (i-l). Start times are indicated with dashed lines in each panel. The target level of vaccination coverage in the total population varies between 20% and 80%, as indicated. Dotted lines mark the end of the vaccination campaign when the target coverage level is reached. The probability of being confirmed, p, is set at either 0.20 (thick gray lines) or 0.65 (thin black lines), and b adjusted accordingly such that R0 = 2.0 for all simulations. Note that the gray and black lines overlap. The inset in panel (i) illustrates the change in the epidemic dynamics at the time vaccination ends.
References
-
- Russell CA, Jones TC, Barr IG, Cox NJ, Garten RJ, Gregory V, Gust ID, Hampson AW, Hay AJ, Hurt AC, de Jong JC, Kelso A, Klimov AI, Kageyama T, Komadina N, Lapedes AS, Lin YP, Mosterin A, Obuchi M, Odagiri T, Osterhaus ADME, Rimmelzwaan GF, Shaw MW, Skepner E, Stohr K, Tashiro M, Fouchier RAM, Smith DJ. The global circulation of seasonal influenza A (H3N2) viruses. Science. 2008;320(5874):340–346. doi: 10.1126/science.1154137. - DOI - PubMed
-
- Simonsen L, Clarke M, Schonberger L, Arden N, Cox N, Fukuda K. Pandemic versus epidemic influenza mortality: A pattern of changing age distribution. The Journal of Infectious Diseases. 1998;178:53–60. - PubMed
-
- Simonsen L. The global impact of influenza on morbidity and mortality. Vaccine. Supplement. 1999;17:S3–S10. - PubMed
MeSH terms
Substances
Grants and funding
LinkOut - more resources
Full Text Sources
Medical
