

Link-based quantitative methods to identify differentially coexpressed genes and gene pairs
- PMID: 21806838
- PMCID: PMC3199761
- DOI: 10.1186/1471-2105-12-315
Link-based quantitative methods to identify differentially coexpressed genes and gene pairs
Abstract
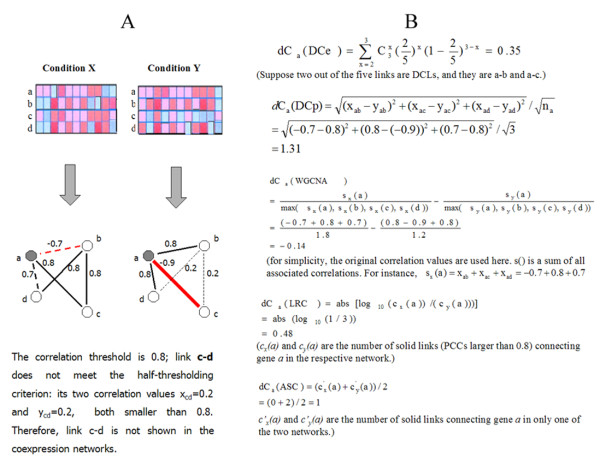
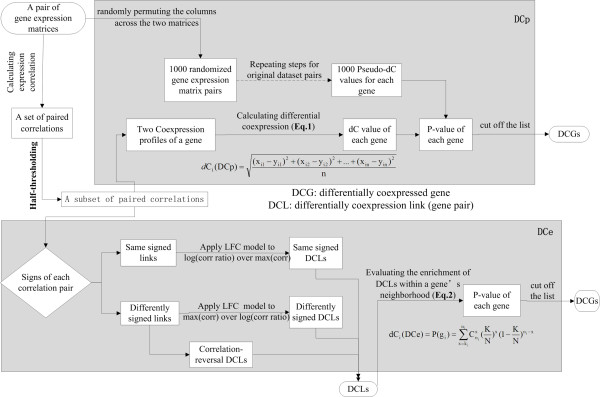
Background: Differential coexpression analysis (DCEA) is increasingly used for investigating the global transcriptional mechanisms underlying phenotypic changes. Current DCEA methods mostly adopt a gene connectivity-based strategy to estimate differential coexpression, which is characterized by comparing the numbers of gene neighbors in different coexpression networks. Although it simplifies the calculation, this strategy mixes up the identities of different coexpression neighbors of a gene, and fails to differentiate significant differential coexpression changes from those trivial ones. Especially, the correlation-reversal is easily missed although it probably indicates remarkable biological significance.
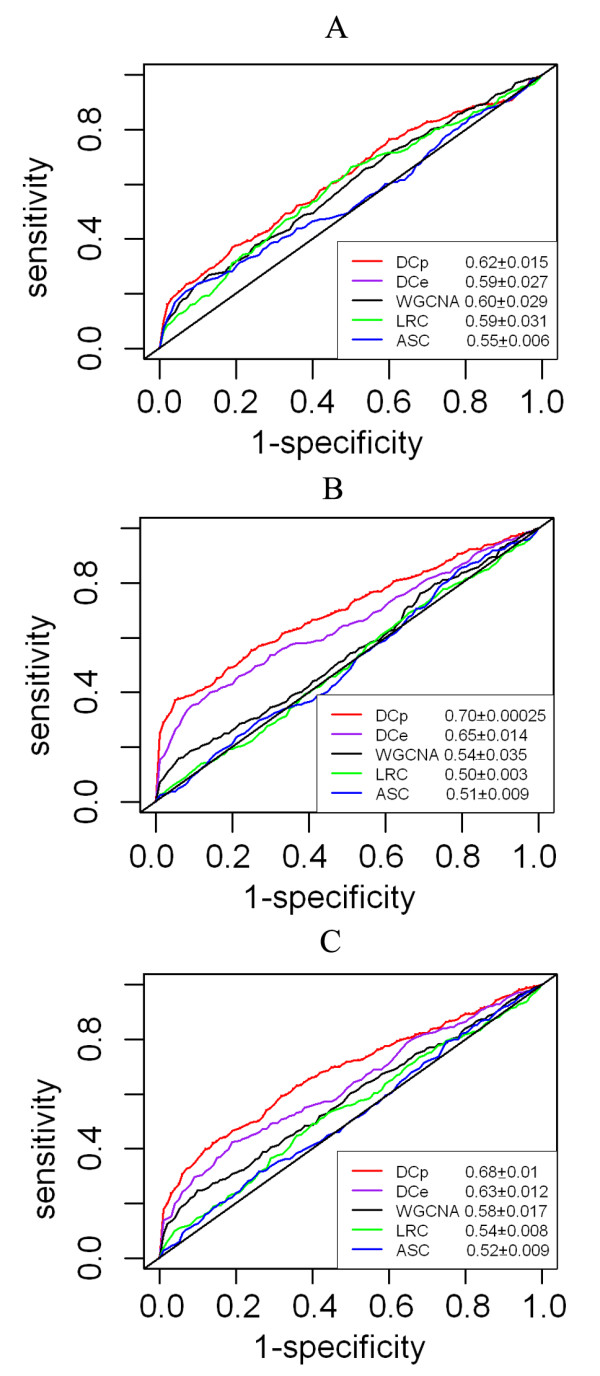
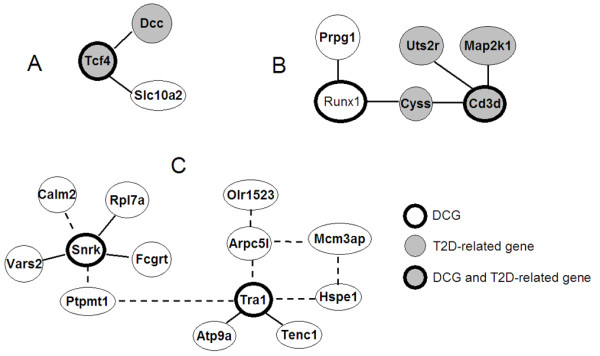
Results: We developed two link-based quantitative methods, DCp and DCe, to identify differentially coexpressed genes and gene pairs (links). Bearing the uniqueness of exploiting the quantitative coexpression change of each gene pair in the coexpression networks, both methods proved to be superior to currently popular methods in simulation studies. Re-mining of a publicly available type 2 diabetes (T2D) expression dataset from the perspective of differential coexpression analysis led to additional discoveries than those from differential expression analysis.
Conclusions: This work pointed out the critical weakness of current popular DCEA methods, and proposed two link-based DCEA algorithms that will make contribution to the development of DCEA and help extend it to a broader spectrum.
Figures
Similar articles
-
DCGL: an R package for identifying differentially coexpressed genes and links from gene expression microarray data.Bioinformatics. 2010 Oct 15;26(20):2637-8. doi: 10.1093/bioinformatics/btq471. Epub 2010 Aug 26. Bioinformatics. 2010. PMID: 20801914 Free PMC article.
-
Module Based Differential Coexpression Analysis Method for Type 2 Diabetes.Biomed Res Int. 2015;2015:836929. doi: 10.1155/2015/836929. Epub 2015 Aug 3. Biomed Res Int. 2015. PMID: 26339648 Free PMC article.
-
Gene differential coexpression analysis based on biweight correlation and maximum clique.BMC Bioinformatics. 2014;15 Suppl 15(Suppl 15):S3. doi: 10.1186/1471-2105-15-S15-S3. Epub 2014 Dec 3. BMC Bioinformatics. 2014. PMID: 25474074 Free PMC article.
-
Detecting Differentially Coexpressed Genes from Labeled Expression Data: A Brief Review.IEEE/ACM Trans Comput Biol Bioinform. 2014 Jan-Feb;11(1):154-67. doi: 10.1109/TCBB.2013.2297921. IEEE/ACM Trans Comput Biol Bioinform. 2014. PMID: 26355515 Review.
-
Approaches in Gene Coexpression Analysis in Eukaryotes.Biology (Basel). 2022 Jul 6;11(7):1019. doi: 10.3390/biology11071019. Biology (Basel). 2022. PMID: 36101400 Free PMC article. Review.
Cited by
-
Analysis of crucial molecules involved in herniated discs and degenerative disc disease.Clinics (Sao Paulo). 2013;68(2):225-30. doi: 10.6061/clinics/2013(02)oa17. Clinics (Sao Paulo). 2013. PMID: 23525320 Free PMC article.
-
Differential Coexpression Analysis Reveals Extensive Rewiring of Arabidopsis Gene Coexpression in Response to Pseudomonas syringae Infection.Sci Rep. 2016 Oct 10;6:35064. doi: 10.1038/srep35064. Sci Rep. 2016. PMID: 27721457 Free PMC article.
-
Differential networking meta-analysis of gastric cancer across Asian and American racial groups.BMC Syst Biol. 2018 Apr 24;12(Suppl 4):51. doi: 10.1186/s12918-018-0564-z. BMC Syst Biol. 2018. PMID: 29745833 Free PMC article.
-
Analysis of master transcription factors related to Parkinson's disease through the gene transcription regulatory network.Arch Med Sci. 2019 Oct 29;17(5):1184-1190. doi: 10.5114/aoms.2019.89460. eCollection 2021. Arch Med Sci. 2019. PMID: 34522247 Free PMC article.
-
Dynamics in Transcriptomics: Advancements in RNA-seq Time Course and Downstream Analysis.Comput Struct Biotechnol J. 2015 Aug 24;13:469-77. doi: 10.1016/j.csbj.2015.08.004. eCollection 2015. Comput Struct Biotechnol J. 2015. PMID: 26430493 Free PMC article. Review.
References
Publication types
MeSH terms
LinkOut - more resources
Full Text Sources
Medical
Miscellaneous
