

Hyperpolarized 13C MR spectroscopic imaging can be used to monitor Everolimus treatment in vivo in an orthotopic rodent model of glioblastoma
- PMID: 21807103
- PMCID: PMC3196046
- DOI: 10.1016/j.neuroimage.2011.07.034
Hyperpolarized 13C MR spectroscopic imaging can be used to monitor Everolimus treatment in vivo in an orthotopic rodent model of glioblastoma
Abstract
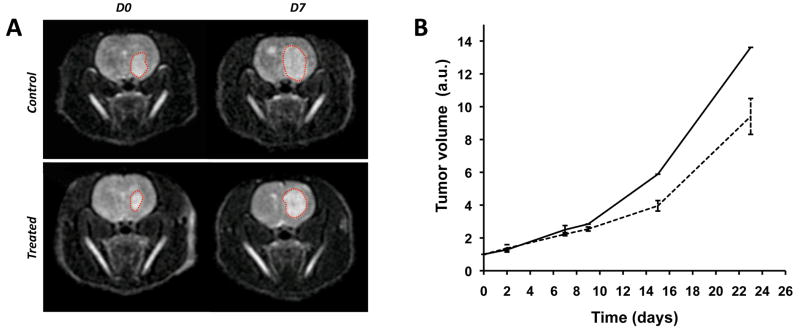
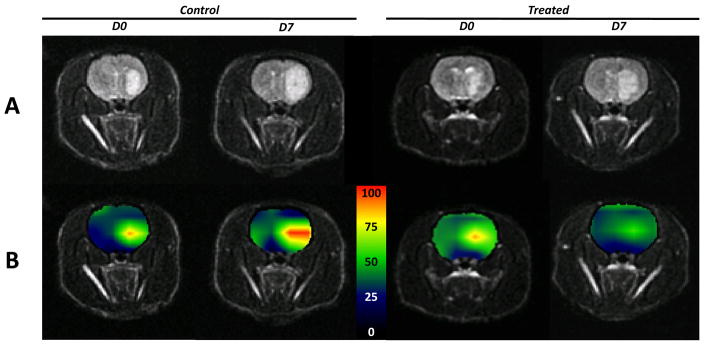
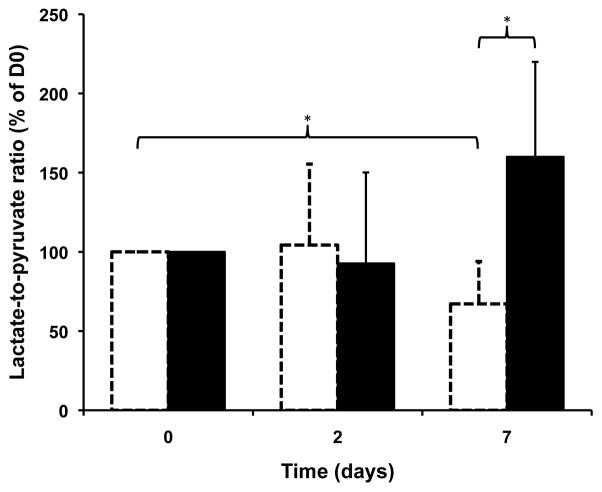
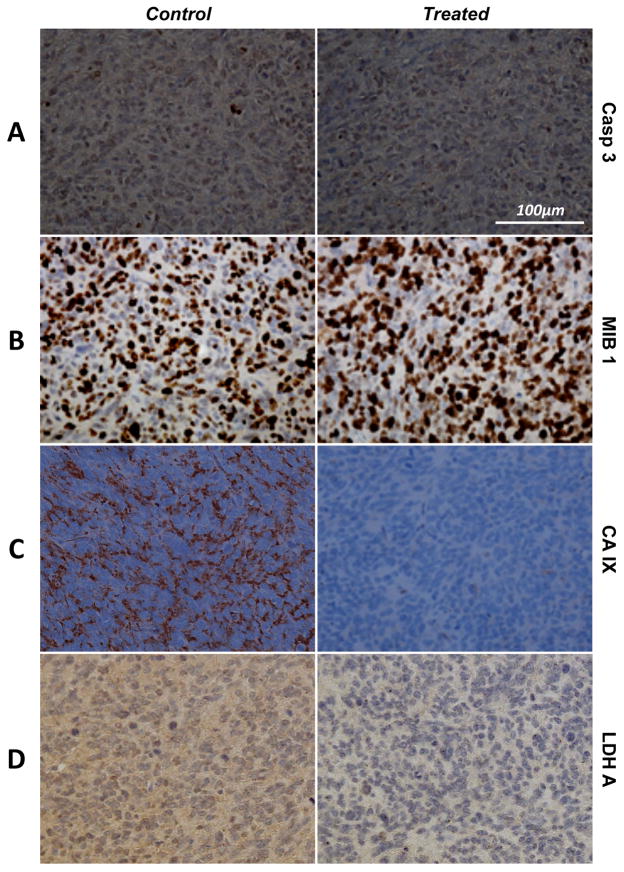
Glioblastoma (GBM) is the most common and lethal primary malignant brain tumor in humans. Because the phosphatidylinositol-3-kinase (PI3K) signaling pathway is activated in more than 88% of GBM, new drugs which target this pathway, such as the mTOR inhibitor Everolimus, are currently in clinical trials. Early tumor response to molecularly targeted treatments remains challenging to assess non-invasively, because it is often associated with tumor stasis or slower tumor growth. Innovative neuroimaging methods are therefore critically needed to provide metabolic or functional information that is indicative of targeted therapeutic action at early time points during the course of treatment. In this study, we demonstrated for the first time that hyperpolarized (HP) 13C magnetic resonance spectroscopic imaging (MRSI) can be used on a clinical MR system to monitor early metabolic response of orthotopic GBM tumors to Everolimus treatment through measurement of the HP lactate-to-pyruvate ratios. The study was performed on a highly invasive non-enhancing orthotopic GBM tumor model in rats (GS-2 tumors), which replicates many fundamental features of human GBM tumors. Seven days after initiation of treatment there was a significant drop in the HP lactate-to-pyruvate ratio from the tumor tissue in treated animals relative to day 0 (67%±27% decrease). In the control group, no significant changes in the HP lactate-to-pyruvate ratios were observed. Importantly, at the 7 day time point, conventional MR imaging (MRI) was unable to detect a significant difference in tumor size between control and treated groups. Inhibition of tumor growth by conventional MRI was observed from day 15 of treatment. This implies that the decrease in the HP lactate-to-pyruvate ratio could be detected before any treatment-induced inhibition of tumor growth. Using immunohistochemical staining to further examine tumor response to treatment, we found that the decrease in the HP lactate-to-pyruvate ratio was associated with a drop in expression of lactate dehydrogenase, the enzyme that catalyzes pyruvate to lactate conversion. Also evident was decreased staining for carbonic anhydrase IX (CA-IX), an indicator of hypoxia-inducible factor 1α (HIF-1α) activity, which, in turn, regulates expression of lactate dehydrogenase. To our knowledge, this study is the first report of the use of HP 13C MRSI at a clinical field strength to monitor GBM response to molecularly targeted treatments. It highlights the potential of HP lactate-to-pyruvate ratio as an early biomarker of response, thereby supporting further investigation of this non-invasive imaging approach for eventual clinical application.
Published by Elsevier Inc.
Figures

References
-
- Albers MJ, Bok R, Chen AP, Cunningham CH, Zierhut ML, Zhang VY, Kohler SJ, Tropp J, Hurd RE, Yen YF, Nelson SJ, Vigneron DB, Kurhanewicz J. 2008 Hyperpolarized 13C lactate, pyruvate, and alanine: noninvasive biomarkers for prostate cancer detection and grading. Cancer Res. 2008;68(20):8607–8615. - PMC - PubMed
-
- Belda-Iniesta C, de Castro Carpeno J, Sereno M, Gonzalez-Baron M, Perona R. Epidermal growth factor receptor and glioblastoma multiforme: molecular basis for a new approach. Clin Transl Oncol. 2008;10(2):73–77. - PubMed
-
- Bunney TD, Katan M. Phosphoinositide signalling in cancer: beyond PI3K and PTEN. Nat Rev Cancer. 2010;10(5):342–352. - PubMed
Publication types
MeSH terms
Substances
Grants and funding
LinkOut - more resources
Full Text Sources
Medical
Research Materials
Miscellaneous
