. 2011 Oct 1;589(Pt 19):4759-76.
doi: 10.1113/jphysiol.2011.212845. Epub 2011 Aug 1.

Muscle sparing in muscle RING finger 1 null mice: response to synthetic glucocorticoids

Affiliations

Muscle sparing in muscle RING finger 1 null mice: response to synthetic glucocorticoids

Leslie M Baehr et al. J Physiol. .

Abstract

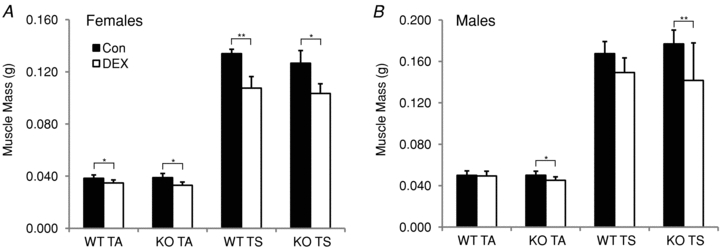
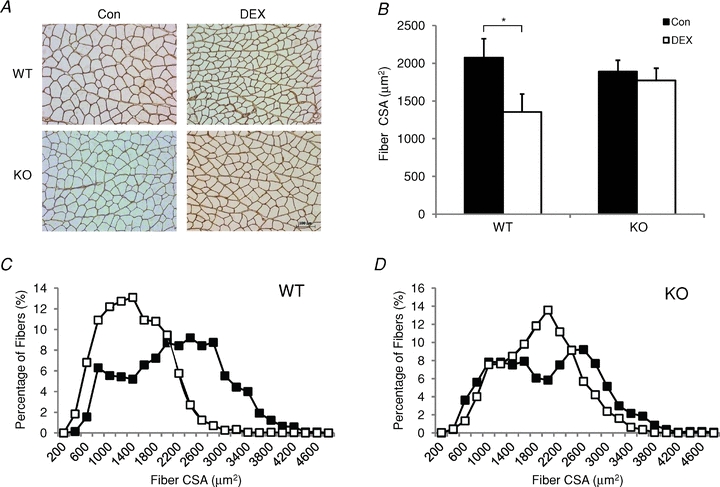
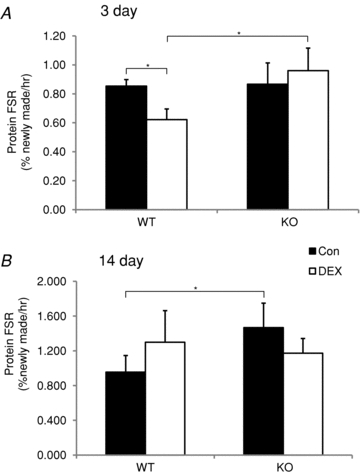
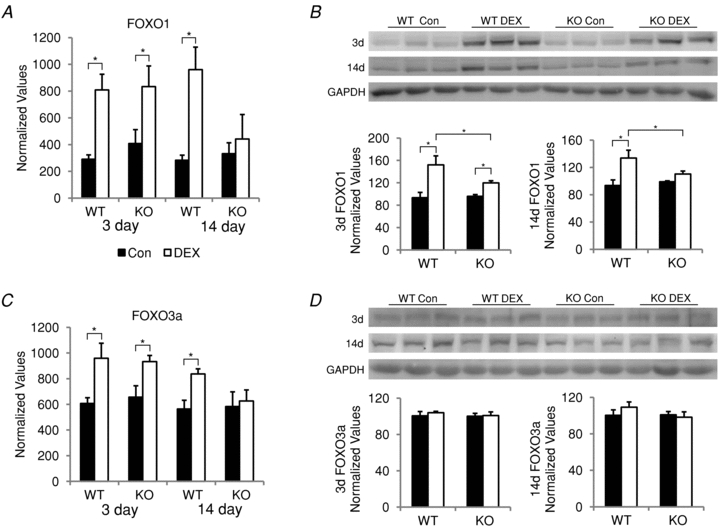
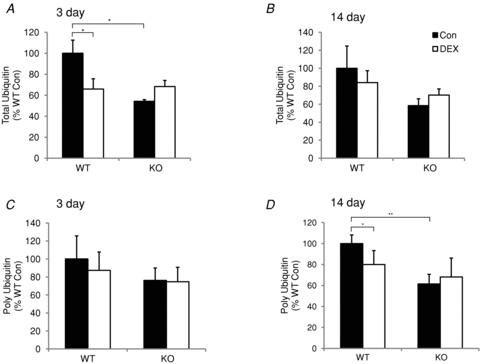
Skeletal muscle atrophy occurs under a variety of conditions and can result from alterations in both protein synthesis and protein degradation. The muscle-specific E3 ubiquitin ligases, MuRF1 and MAFbx, are excellent markers of muscle atrophy and increase under divergent atrophy-inducing conditions such as denervation and glucocorticoid treatment. While deletion of MuRF1 or MAFbx has been reported to spare muscle mass following 14 days of denervation, their role in other atrophy-inducing conditions is unclear. The goal of this study was to determine whether deletion of MuRF1 or MAFbx attenuates muscle atrophy after 2 weeks of treatment with the synthetic glucocorticoid dexamethasone (DEX). The response of the triceps surae (TS) and tibialis anterior (TA) muscles to 14 days of DEX treatment (3 mg kg(-1) day(-1)) was examined in 4 month-old male and female wild type (WT) and MuRF1 or MAFbx knock out (KO) mice. Following 14 days of DEX treatment, muscle wet weight was significantly decreased in the TS and TA of WT mice. Comparison of WT and KO mice following DEX treatment revealed significant sparing of mass in both sexes of the MuRF1 KO mice, but no muscle sparing in MAFbx KO mice. Further analysis of the MuRF1 KO mice showed significant sparing of fibre cross-sectional area and tension output in the gastrocnemius (GA) after DEX treatment. Muscle sparing in the MuRF1 KO mice was related to maintenance of protein synthesis, with no observed increases in protein degradation in either WT or MuRF1 KO mice. These results demonstrate that MuRF1 and MAFbx do not function similarly under all atrophy models, and that the primary role of MuRF1 may extend beyond controlling protein degradation via the ubiquitin proteasome system.


Figures

Figure 1
Figure 1. Comparison of dexamethasone (DEX) treatment on body weight and muscle mass in wild type (WT) and MuRF1 null (KO) mice
Female (A and C) and male (B and D) WT and MuRF1 KO mice were treated with DEX for a period of 14 days. Body weight was measured every 2 days in WT (filled squares) and KO (open squares) DEX-treated mice and the mean ± SEM was plotted for female (A) and male (B) mice (n = 8–10 per group). *denotes within group comparison relative to day 0 (P < 0.05), † denotes across group comparison of treatment effect on WT and KO mice (P < 0.05). The average mass (mean ± SD, wet weight in grams) of the tibialis anterior (TA) and triceps surae (TS) was calculated in female (C) and male (D) WT and MuRF1 KO mice after no treatment (Con, filled bars) or 14 days of DEX treatment (open bars). *P < 0.05, **P < 0.001.
Figure 2
Figure 2. Comparison of dexamethasone (DEX) treatment on muscle mass in wild type (WT) and MAFbx null (KO) mice
The average mass (mean ± SD, wet weight in grams) of the tibialis anterior (TA) and triceps surae (TS) was calculated in female (A) and male (B) WT and MAFbx KO mice after no treatment (Con, filled bars) or 14 days of DEX treatment (open bars). *P < 0.05, **P < 0.001.
Figure 3
Figure 3. Sparing of muscle fibre size in MuRF1 null (KO) mice following 14 days of dexamethasone (DEX) treatment
The fibre cross-sectional area (CSA) of muscle fibres in the gastrocnemius muscle (GA) of female wild type (WT) and MuRF1 KO mice were determined from laminin-stained cross-sections. A, representative laminin-stained cross-sections of the same region within the GA muscle for each experimental group. Original magnification ×200, scale bar: 100 μm. B, histogram of the mean ± SD fibre CSA from the GA of control (filled bars) and 14 day DEX-treated (open bars) WT and MuRF1 KO mice (n = 3–5 per group). *P < 0.01. C and D, distributions of fibre cross-sectional areas of fibres in the GA of WT (C) and KO (D) mice following no treatment (Con, filled squares) or 14 days of DEX treatment (DEX, open squares).
Figure 4
Figure 4. Effect of dexamethasone (DEX) treatment on the protein fractional synthesis rate
The protein fractional synthesis rate (FSR) was measured in the triceps surae (soleus, plantaris, gastrocnemius) of wild type (WT) and MuRF1 null (KO) mice after 3 (A) and 14 (B) days of either no treatment (Con, filled bars) or DEX treatment (DEX, open bars). FSR is expressed as % newly made proteins per hour. Data are mean ± SD for n = 3–4 per group. *P < 0.05.
Figure 5
Figure 5. Expression of MuRF1 and MAFbx in wild type (WT) and MuRF1 null (KO) mice after dexamethasone (DEX) treatment
MuRF1 and MAFbx expression was measured in the triceps surae of female mice after either 3 or 14 days of DEX treatment. A, quantitative PCR was performed to measure MuRF1 expression in control (filled bars) and DEX-treated (open bars) WT and MuRF1 KO mice. Expression values were normalized to Rpl39 and expressed as mean ± SD (n = 3–4 per group). As expected, MuRF1 expression was not detected in the KO mice. *P < 0.05. B, MAFbx expression was assessed by Northern blot and quantified by densitometry in control (filled bars) and DEX-treated (open bars) WT and MuRF1 KO mice. *P < 0.01.
Figure 6
Figure 6. FOXO mRNA and protein expression in wild type (WT) and MuRF1 null (KO) mice after dexamethasone (DEX) treatment
FOXO1 and FOXO3a mRNA and protein expression was measured in the triceps surae of female mice after either 3 or 14 days of DEX treatment. FOXO1 (A) and FOXO3a (C) mRNA expression in control (filled bars) and DEX-treated (open bars) WT and MuRF1 KO mice was assessed by qPCR. Expression values were normalized to Rpl39 and expressed as mean ± SD (n = 3–4 per group). *P < 0.001. Western blots of FOXO1 (B) and FOXO3a (D) protein expression in control (filled bars) and DEX-treated (open bars) WT and MuRF1 KO mice. Protein expression was quantified by densitometry and normalized to GAPDH. *P < 0.05.
Figure 7
Figure 7. Total ubiquitin and polyubiquitin levels in wild type (WT) or MuRF1 null (KO) mice after dexamethasone (DEX) treatment
Total ubiquitin and polyubiquitin were measured in the triceps surae of female mice after either 3 or 14 days of DEX treatment. Total ubiquitin levels were measured by ELISA after either 3 (A) or 14 (B) days in WT and KO mice following no treatment (Con, filled bars) or DEX treatment (DEX, open bars). Polyubiquitin levels were measured by ELISA after either 3 (C) or 14 (D) days in WT and KO mice following no treatment (Con, filled bars) or DEX treatment (DEX, open bars). Data are expressed as a per cent of WT control values (mean ± SD, n = 3–4 per group). *P < 0.05, **P < 0.001.
Figure 8
Figure 8. 26S proteasome activity in wild type (WT) and MuRF1 null (KO) mice after dexamethasone (DEX) treatment
26S β5 proteasome activity was measured by fluorometric assay after either 3 (A) or 14 (B) days in WT and KO mice following no treatment (Con, filled bars) or DEX treatment (DEX, open bars). Data are expressed as a per cent of WT control (n = 3–4 per group). *P < 0.05. C, a representative Western blot of β5 and GAPDH protein levels in control and DEX-treated WT and MuRF1 KO mice.
Figure 9
Figure 9. Response of wild type (WT) and MuRF1 null (KO) mice to 3 days of nutritional deprivation (ND)
A, the average mass (mean ± SD, wet weight in grams) of the tibialis anterior (TA) and triceps surae (TS) was calculated in female WT and MuRF1 KO mice after no treatment (control, filled bars) or 3 days of ND (open bars). B, MuRF1, MAFbx, FOXO1 and FOXO3a mRNA expression levels were measured by qPCR in WT and MuRF1 KO mice following no treatment (Con, filled bars) or 3 days of ND (open bars). Expression levels were normalized to Rpl39 expression and expressed as a per cent of WT control (mean ± SD, n = 3–6 per group). *P < 0.05.

Comment in

Similar articles

Cited by

References

    1. Accili D, Arden KC. FoxOs at the crossroads of cellular metabolism, differentiation, and transformation. Cell. 2004;117:421–426. - PubMed
    1. Anderson SR, Gilge DA, Steiber AL, Previs SF. Diet-induced obesity alters protein synthesis: tissue-specific effects in fasted versus fed mice. Metabolism. 2008;57:347–354. - PMC - PubMed
    1. Auclair D, Garrel DR, Chaouki Zerouala A, Ferland LH. Activation of the ubiquitin pathway in rat skeletal muscle by catabolic doses of glucocorticoids. Am J Physiol Cell Physiol. 1997;272:C1007–C1016. - PubMed
    1. Baltgalvis KA, Call JA, Nikas JB, Lowe DA. Effects of prednisolone on skeletal muscle contractility in mdx mice. Muscle Nerve. 2009;40:443–454. - PMC - PubMed
    1. Barry SC, Gallagher CG. Corticosteroids and skeletal muscle function in cystic fibrosis. J Appl Physiol. 2003;95:1379–1384. - PubMed

Publication types

MeSH terms