Review
. 2011 Sep 12;366(1577):2478-502.
doi: 10.1098/rstb.2011.0023.

The historical biogeography of Mammalia

Affiliations
Review

The historical biogeography of Mammalia

Mark S Springer et al. Philos Trans R Soc Lond B Biol Sci. .

Abstract

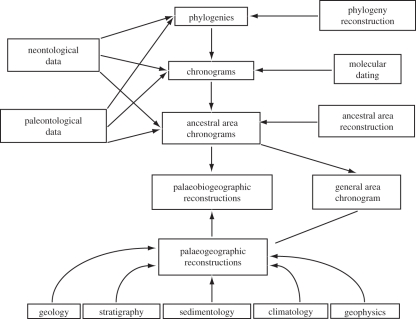
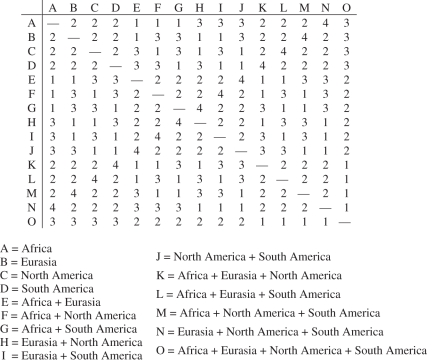
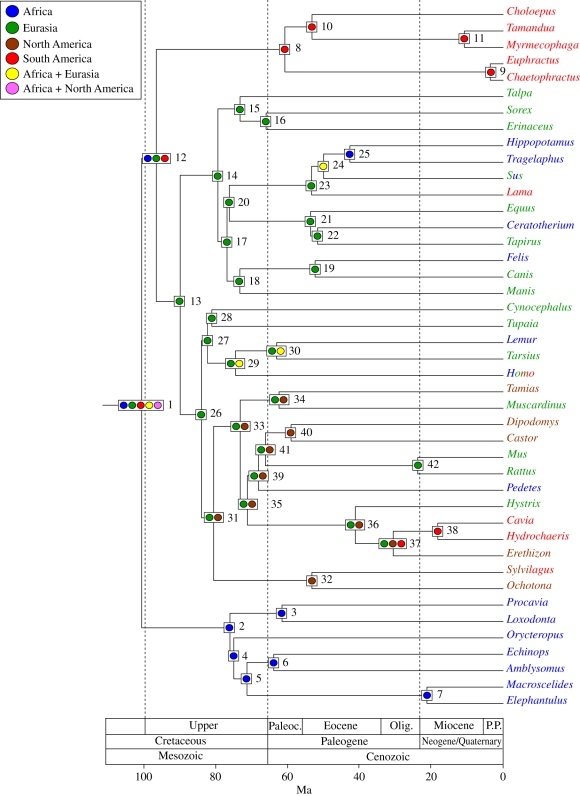
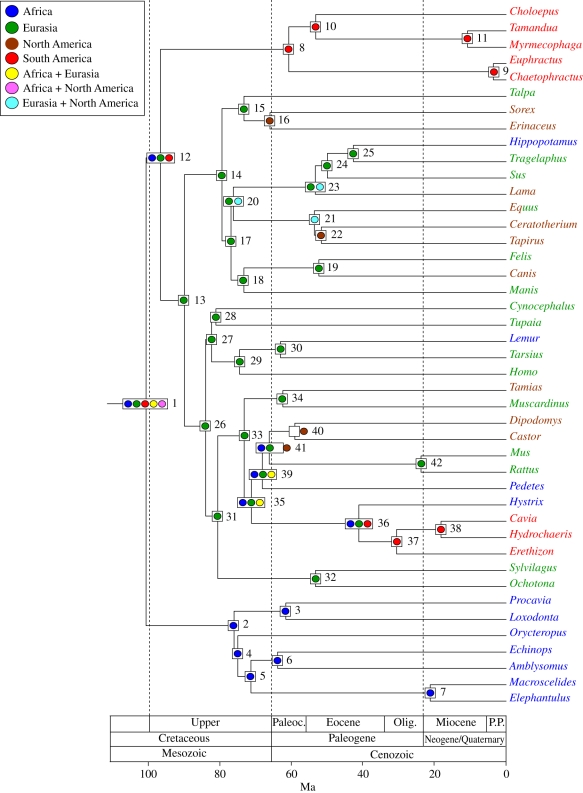
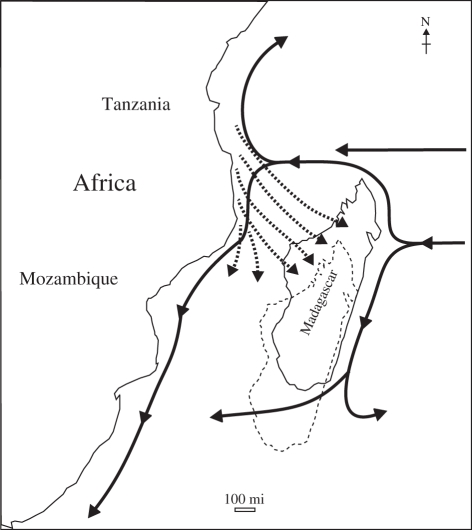
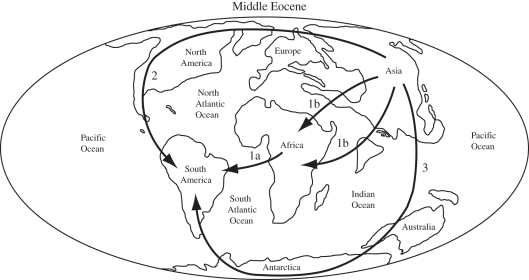
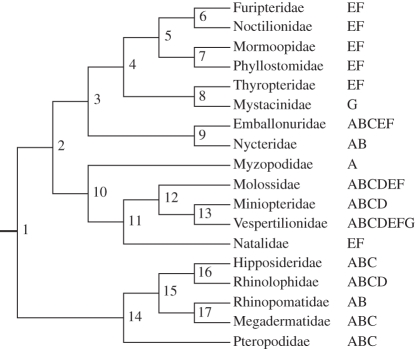
Palaeobiogeographic reconstructions are underpinned by phylogenies, divergence times and ancestral area reconstructions, which together yield ancestral area chronograms that provide a basis for proposing and testing hypotheses of dispersal and vicariance. Methods for area coding include multi-state coding with a single character, binary coding with multiple characters and string coding. Ancestral reconstruction methods are divided into parsimony versus Bayesian/likelihood approaches. We compared nine methods for reconstructing ancestral areas for placental mammals. Ambiguous reconstructions were a problem for all methods. Important differences resulted from coding areas based on the geographical ranges of extant species versus the geographical provenance of the oldest fossil for each lineage. Africa and South America were reconstructed as the ancestral areas for Afrotheria and Xenarthra, respectively. Most methods reconstructed Eurasia as the ancestral area for Boreoeutheria, Euarchontoglires and Laurasiatheria. The coincidence of molecular dates for the separation of Afrotheria and Xenarthra at approximately 100 Ma with the plate tectonic sundering of Africa and South America hints at the importance of vicariance in the early history of Placentalia. Dispersal has also been important including the origins of Madagascar's endemic mammal fauna. Further studies will benefit from increased taxon sampling and the application of new ancestral area reconstruction methods.


Figures

Figure 1.
Figure 1.
A flowchart of the approach used for incorporating different types of data, in conjunction with methods in phylogeny reconstruction, molecular dating and ancestral area reconstruction, for inferring ancestral area chronograms and palaeobiogeographic history.
Figure 2.
Figure 2.
Example of a step matrix for minimum area change (MAC) parsimony. MAC parsimony assigns equal cost to all gains and losses of an area. For example, a change in area from A (Africa) to G (Africa + South America) requires one step (gain South America), whereas a change from A to H (Eurasia + North America) requires three steps (Africa loss, Eurasia gain, North America gain). The step matrix is fully symmetrical.
Figure 3.
Figure 3.
Ancestral area chronogram for 43 placental taxa from Springer et al. [3] with area coding based on extant ranges for terminal taxa. RAxML was used to infer phylogenetic relationships, BEAST was used to infer divergence times, MAC parsimony was used to infer ancestral areas with the step matrix in figure 2. We employed soft constraints (nodes 3, 8, 10, 16, 19, 21, 32, 34, 36, 38, 41) that followed a normal distribution, with 95% of the normal distribution between the specified minimum and maximum constraints (table 1). Areas for extant taxa are enumerated in table 2 and are colour-coded as follows: Africa, blue; Eurasia, green; North America, brown; South America, red. Multi-coloured names denote taxa that occur in more than one area (table 2). Nodes with unambiguous ancestral area reconstructions are shown with a single coloured circle; nodes with ambiguous reconstructions are shown with two or more circles, and each coloured circle corresponds to a different reconstruction.
Figure 4.
Figure 4.
Ancestral area chronogram for 43 placental taxa from Springer et al. [3] with area coding based on the oldest fossil for each lineage. RAxML was used to infer phylogenetic relationships, BEAST was used to infer divergence times, and MAC parsimony was used to infer ancestral areas with the step matrix in figure 2. Areas for the oldest fossil lineage are enumerated in table 2 and are colour-coded as follows: Africa, blue; Eurasia, green; North America, brown; South America, red. Nodes with unambiguous ancestral area reconstructions are shown with a single coloured circle; nodes with ambiguous reconstructions are shown with two or more circles, and each coloured circle corresponds to a different reconstruction.
Figure 5.
Figure 5.
Present day surface ocean currents in the Mozambique Channel (solid arrows) are south–southwest and would not have facilitated west to east transoceanic dispersal from Africa to Madagascar [153]. By contrast, westerly surface ocean currents in the Eocene (dashed arrows) would have facilitated dispersal across the Mozambique Channel from Africa to Madagascar, especially during tropical storms [154]. The outline of Madagascar with dashed lines shows its approximate position relative to Africa during the Eocene.
Figure 6.
Figure 6.
Alternate hypotheses for the dispersal of platyrrhine and caviomorph ancestors, respectively, from Africa/Asia to South America. Hypothesis 1: transoceanic dispersal (1a) from Africa to South America, possibly with an earlier dispersal from Asia to Africa (1b) if origination occurred in Asia. Hypothesis 2: dispersal from Asia through North America to South America. Hypothesis 3: dispersal from Asia to South America via Australia and Antarctica after two transoceanic crossings. Middle Eocene world map based on Palaeomap Project (http://www.scotse.com/newpage9.htm).
Figure 7.
Figure 7.
Eick et al.'s [12] phylogeny and area coding for extant bat families. Ancestral area reconstructions based on DIVA analyses are shown in table 6 for nodes 1–17. Africa, A; Asia, B; Australia, C; Europe, D; North America, E; South America, F; New Zealand, G.

Similar articles

Cited by

References

    1. Jones K. E., Safi K. 2011. Ecology and evolution of mammalian biodiversity. Phil. Trans. R. Soc. B 366, 2451–246110.1098/rstb.2011.0090 (doi:10.1098/rstb.2011.0090) - DOI - DOI - PMC - PubMed
    1. Simpson G. G. 1940. Mammals and land bridges. J. Washington D.C. Acad. Sci. 30, 137–163
    1. Springer M. S., Burk-Herrick A., Meredith R., Eizirik E., Teeling E., O'Brien S. J., Murphy W. J. 2007. The adequacy of morphology for reconstructing the early history of placental mammals. Syst. Biol. 56, 673–68410.1080/10635150701491149 (doi:10.1080/10635150701491149) - DOI - DOI - PubMed
    1. Springer M. S., Meredith R. W., Eizirik E., Teeling E., Murphy W. J. 2008. Morphology and placental mammal phylogeny. Syst. Biol. 57, 499–50310.1080/10635150802164504 (doi:10.1080/10635150802164504) - DOI - DOI - PubMed
    1. Bollback J. P. 2006. SIMMAP: stochastic character mapping of discrete traits on phylogenies. BMC Bioinform. 7, 88.10.1186/1471-2105-7-88 (doi:10.1186/1471-2105-7-88) - DOI - DOI - PMC - PubMed

Publication types

LinkOut - more resources