

Understanding global patterns of mammalian functional and phylogenetic diversity
- PMID: 21807734
- PMCID: PMC3138614
- DOI: 10.1098/rstb.2011.0024
Understanding global patterns of mammalian functional and phylogenetic diversity
Abstract
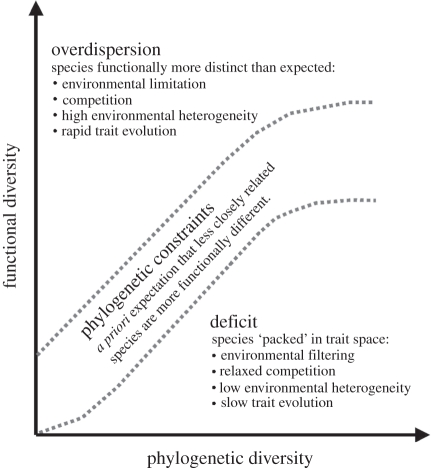
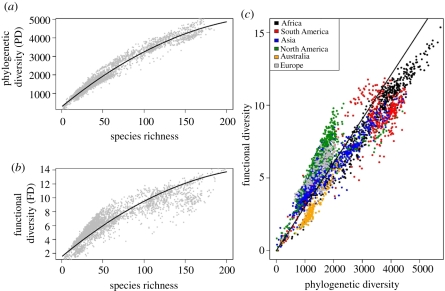
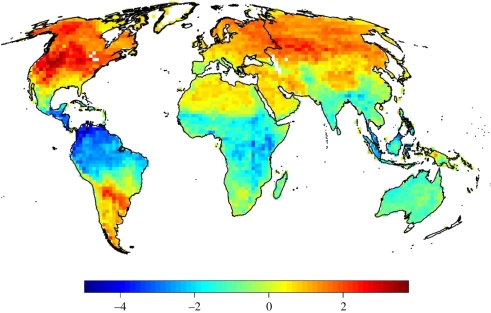
Documenting and exploring the patterns of diversity of life on Earth has always been a central theme in biology. Species richness despite being the most commonly used measure of diversity in macroecological studies suffers from not considering the evolutionary and ecological differences among species. Phylogenetic diversity (PD) and functional diversity (FD) have been proposed as alternative measures to overcome this limitation. Although species richness, PD and FD are closely related, their relationships have never been investigated on a global scale. Comparing PD and FD with species richness corroborated the general assumptions of surrogacy of the different diversity measures. However, the analysis of the residual variance suggested that the mismatches between the diversity measures are influenced by environmental conditions. PD increased relative to species richness with increasing mean annual temperature, whereas FD decreased with decreasing seasonality relative to PD. We also show that the tropical areas are characterized by a FD deficit, a phenomenon, that suggests that in tropical areas more species can be packed into the ecological space. We discuss potential mechanisms that could have resulted in the gradient of spatial mismatch observed in the different biodiversity measures and draw parallels to local scale studies. We conclude that the use of multiple diversity measures on a global scale can help to elucidate the relative importance of historical and ecological processes shaping the present gradients in mammalian diversity.
Figures
References
-
- Magurran A. 2004. Measuring biological diversity. Oxford, UK: Blackwell Science
-
- Tilman D. 1997. Biodiversity and ecosystem function. In Nature's services: societal dependence on natural ecosystems, pp. 93–112 Wahington, DC: Island Press
-
- Stevens R. D., Cox S. B., Strauss R. E., Willig M. R. 2003. Patterns of functional diversity across an extensive environmental gradient: vertebrate consumers, hidden treatments and latitudinal trends. Ecol. Lett. 6, 1099–1108 10.1046/j.1461-0248.2003.00541.x (doi:10.1046/j.1461-0248.2003.00541.x) - DOI
-
- Faith D. P. 1992. Conservation evaluation and phylogenetic diversity. Biol. Conserv. 61, 1–10 10.1016/0006-3207(92)91201-3 (doi:10.1016/0006-3207(92)91201-3) - DOI
-
- Hooper D. U., et al. 2002. Species diversity, functional diversity, and ecosystem functioning. In Biodiversity and ecosystem functioning: synthesis and perspectives (eds Inchausti P., Loreau M., Naeem S.), pp. 195–208 New York, NY: Oxford University Press
Publication types
MeSH terms
LinkOut - more resources
Full Text Sources