

The ghosts of mammals past: biological and geographical patterns of global mammalian extinction across the Holocene
- PMID: 21807737
- PMCID: PMC3138610
- DOI: 10.1098/rstb.2011.0020
The ghosts of mammals past: biological and geographical patterns of global mammalian extinction across the Holocene
Abstract
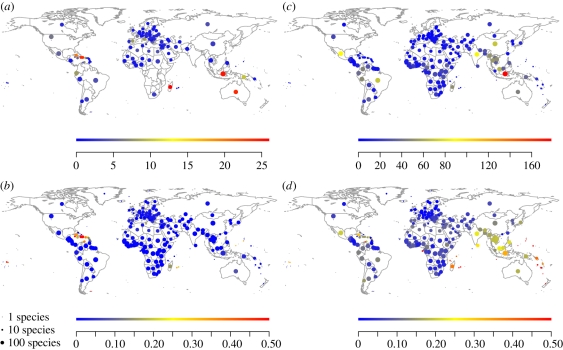
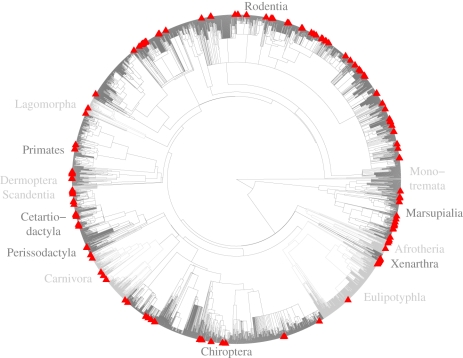
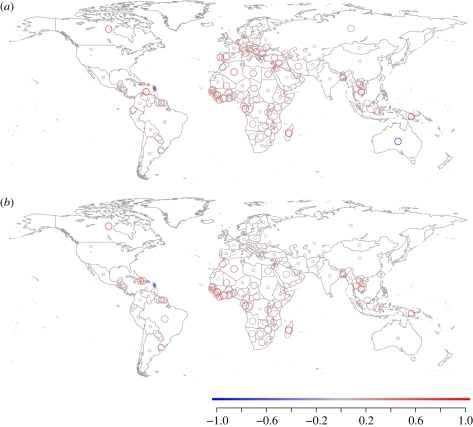
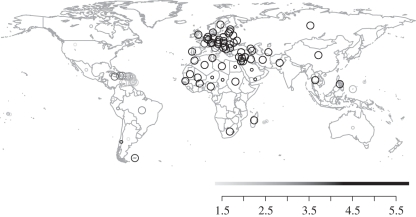
Although the recent historical period is usually treated as a temporal base-line for understanding patterns of mammal extinction, mammalian biodiversity loss has also taken place throughout the Late Quaternary. We explore the spatial, taxonomic and phylogenetic patterns of 241 mammal species extinctions known to have occurred during the Holocene up to the present day. To assess whether our understanding of mammalian threat processes has been affected by excluding these taxa, we incorporate extinct species data into analyses of the impact of body mass on extinction risk. We find that Holocene extinctions have been phylogenetically and spatially concentrated in specific taxa and geographical regions, which are often not congruent with those disproportionately at risk today. Large-bodied mammals have also been more extinction-prone in most geographical regions across the Holocene. Our data support the extinction filter hypothesis, whereby regional faunas from which susceptible species have already become extinct now appear less threatened; they may also suggest that different processes are responsible for driving past and present extinctions. We also find overall incompleteness and inter-regional biases in extinction data from the recent fossil record. Although direct use of fossil data in future projections of extinction risk is therefore not straightforward, insights into extinction processes from the Holocene record are still useful in understanding mammalian threat.
Figures
References
-
- Collen B., McRae L., Deinet S., De Palma A., Carranza T., Cooper N., Loh J., Baillie J. E. M. 2011. Predicting how populations decline to extinction. Phil. Trans. R. Soc. B 366, 2577–258610.1098/rstb.2011.0015 (doi:10.1098/rstb.2011.0015) - DOI - DOI - PMC - PubMed
-
- Schipper J., et al. 2008. The status of the world's land and marine mammals: diversity, threat, and knowledge. Science 322, 225–23010.1126/science.1165115 (doi:10.1126/science.1165115) - DOI - DOI - PubMed
-
- Bininda-Emonds O. R. P., et al. 2007. The delayed rise of present-day mammals. Nature 446, 507–512 [Corrigendum in Nature 2008 456, 274]10.1038/nature05634 (doi:10.1038/nature05634) - DOI - DOI - PubMed
-
- Jones K. E., et al. 2009. PanTHERIA: a species-level database of life history, ecology and geography of extant and recently extinct mammals. Ecology 90, 2648.10.1890/08-1494.1 (doi:10.1890/08-1494.1) - DOI - DOI
-
- Purvis A., Gittleman J. L., Cowlishaw G., Mace G. M. 2000. Predicting extinction risk in declining species. Proc. R. Soc. Lond. B 267, 1947–195210.1098/rspb.2000.1234 (doi:10.1098/rspb.2000.1234) - DOI - DOI - PMC - PubMed
Publication types
MeSH terms
LinkOut - more resources
Full Text Sources
Miscellaneous