

Functional characterization of evolutionarily divergent 4-coumarate:coenzyme a ligases in rice
- PMID: 21807887
- PMCID: PMC3192572
- DOI: 10.1104/pp.111.178301
Functional characterization of evolutionarily divergent 4-coumarate:coenzyme a ligases in rice
Abstract
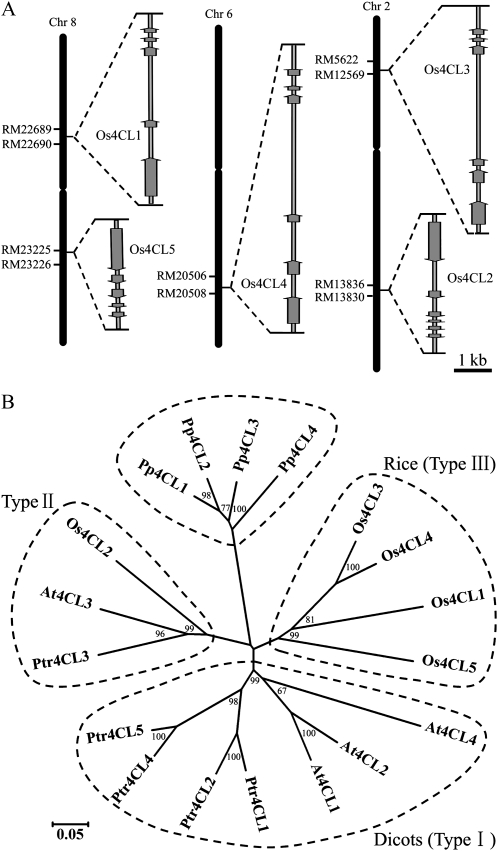
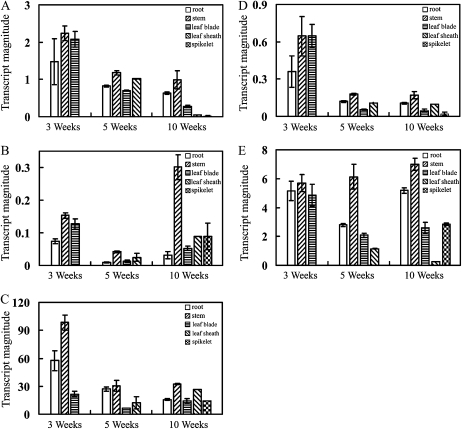
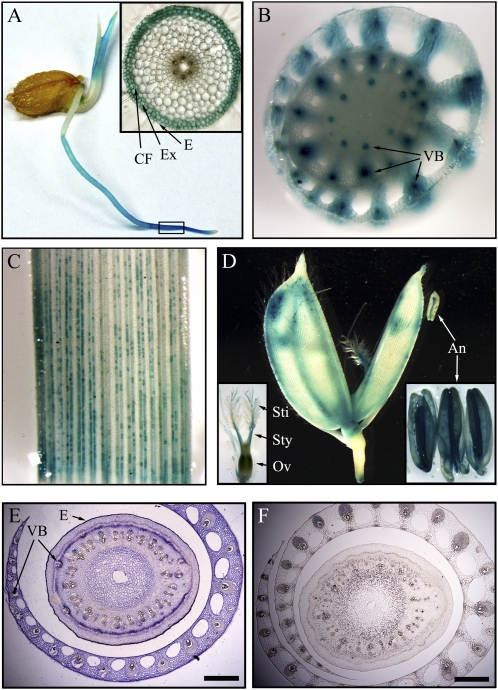
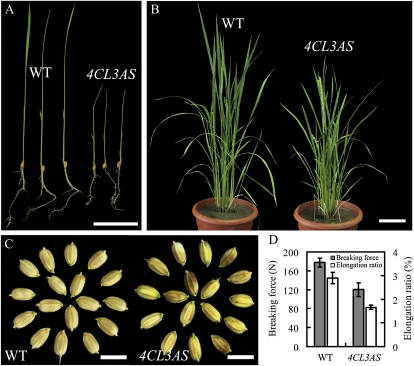
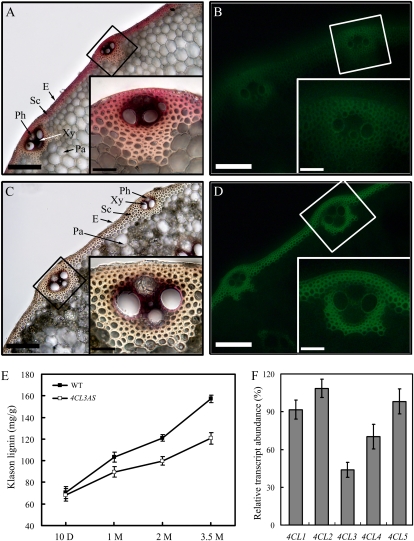
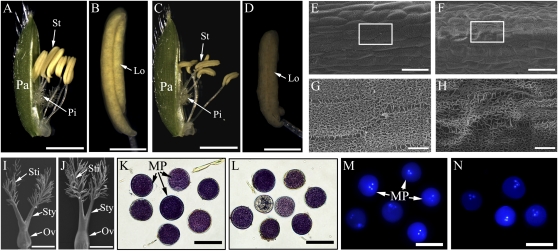
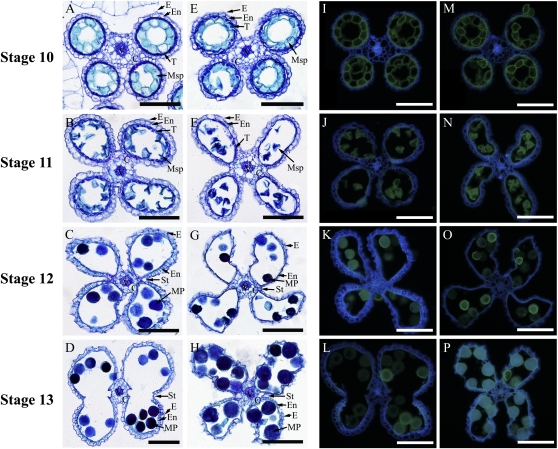
4-Coumarate:coenzyme A ligase (4CL; EC 6.2.1.12) is a key enzyme in the phenylpropanoid metabolic pathways for monolignol and flavonoid biosynthesis. 4CL has been much studied in dicotyledons, but its function is not completely understood in monocotyledons, which display a different monolignol composition and phenylpropanoid profile. In this study, five members of the 4CL gene family in the rice (Oryza sativa) genome were cloned and analyzed. Biochemical characterization of the 4CL recombinant proteins revealed that the rice 4CL isoforms displayed different substrate specificities and catalytic turnover rates. Among them, Os4CL3 exhibited the highest turnover rate. No apparent tissue-specific expression of the five 4CLs was observed, but significant differences in their expression levels were detected. The rank in order of transcript abundance was Os4CL3 > Os4CL5 > Os4CL1 > Os4CL4 > Os4CL2. Suppression of Os4CL3 expression resulted in significant lignin reduction, shorter plant growth, and other morphological changes. The 4CL-suppressed transgenics also displayed decreased panicle fertility, which may be attributed to abnormal anther development as a result of disrupted lignin synthesis. This study demonstrates that the rice 4CLs exhibit different in vitro catalytic properties from those in dicots and that 4CL-mediated metabolism in vivo may play important roles in regulating a broad range of biological events over the course of rice growth and development.
Figures
Similar articles
-
Analysis of five rice 4-coumarate:coenzyme A ligase enzyme activity and stress response for potential roles in lignin and flavonoid biosynthesis in rice.Biochem Biophys Res Commun. 2013 Jan 18;430(3):1151-6. doi: 10.1016/j.bbrc.2012.12.019. Epub 2012 Dec 14. Biochem Biophys Res Commun. 2013. PMID: 23246835
-
Genome-edited rice deficient in two 4-COUMARATE:COENZYME A LIGASE genes displays diverse lignin alterations.Plant Physiol. 2022 Nov 28;190(4):2155-2172. doi: 10.1093/plphys/kiac450. Plant Physiol. 2022. PMID: 36149320 Free PMC article.
-
Differential substrate inhibition couples kinetically distinct 4-coumarate:coenzyme a ligases with spatially distinct metabolic roles in quaking aspen.Plant Physiol. 2002 Feb;128(2):428-38. doi: 10.1104/pp.010603. Plant Physiol. 2002. PMID: 11842147 Free PMC article.
-
Structural, functional and evolutionary diversity of 4-coumarate-CoA ligase in plants.Planta. 2018 Nov;248(5):1063-1078. doi: 10.1007/s00425-018-2965-z. Epub 2018 Aug 4. Planta. 2018. PMID: 30078075 Review.
-
Trends in lignin modification: a comprehensive analysis of the effects of genetic manipulations/mutations on lignification and vascular integrity.Phytochemistry. 2002 Oct;61(3):221-94. doi: 10.1016/s0031-9422(02)00211-x. Phytochemistry. 2002. PMID: 12359514 Review.
Cited by
-
Analysis of the spatial and temporal expression pattern directed by the Populus tomentosa 4-coumarate:CoA ligase Pto4CL2 promoter in transgenic tobacco.Mol Biol Rep. 2013 Mar;40(3):2309-17. doi: 10.1007/s11033-012-2312-6. Epub 2012 Nov 27. Mol Biol Rep. 2013. PMID: 23184048
-
Comparative Multi-Omics Analysis Reveals Lignin Accumulation Affects Peanut Pod Size.Int J Mol Sci. 2022 Nov 4;23(21):13533. doi: 10.3390/ijms232113533. Int J Mol Sci. 2022. PMID: 36362327 Free PMC article.
-
Rice co-expression network analysis identifies gene modules associated with agronomic traits.Plant Physiol. 2022 Sep 28;190(2):1526-1542. doi: 10.1093/plphys/kiac339. Plant Physiol. 2022. PMID: 35866684 Free PMC article.
-
RNA Sequencing Reveals Phenylpropanoid Biosynthesis Genes and Transcription Factors for Hevea brasiliensis Reaction Wood Formation.Front Genet. 2021 Oct 29;12:763841. doi: 10.3389/fgene.2021.763841. eCollection 2021. Front Genet. 2021. PMID: 34777481 Free PMC article.
-
Tricin Biosynthesis and Bioengineering.Front Plant Sci. 2021 Aug 26;12:733198. doi: 10.3389/fpls.2021.733198. eCollection 2021. Front Plant Sci. 2021. PMID: 34512707 Free PMC article. Review.
References
-
- Boerjan W, Ralph J, Baucher M. (2003) Lignin biosynthesis. Annu Rev Plant Biol 54: 519–546 - PubMed
-
- Chaw SM, Chang CC, Chen HL, Li WH. (2004) Dating the monocot-dicot divergence and the origin of core eudicots using whole chloroplast genomes. J Mol Evol 58: 424–441 - PubMed
-
- Chen F, Srinivasa Reddy MS, Temple S, Jackson L, Shadle G, Dixon RA. (2006) Multi-site genetic modulation of monolignol biosynthesis suggests new routes for formation of syringyl lignin and wall-bound ferulic acid in alfalfa (Medicago sativa L.). Plant J 48: 113–124 - PubMed
-
- de O Buanafina MM. (2009) Feruloylation in grasses: current and future perspectives. Mol Plant 2: 861–872 - PubMed
Publication types
MeSH terms
Substances
LinkOut - more resources
Full Text Sources
Research Materials
