. 2011 Oct;31(19):3938-52.
doi: 10.1128/MCB.05570-11. Epub 2011 Aug 1.

Raft protein clustering alters N-Ras membrane interactions and activation pattern

Affiliations

Raft protein clustering alters N-Ras membrane interactions and activation pattern

Sharon Eisenberg et al. Mol Cell Biol. 2011 Oct.

Abstract

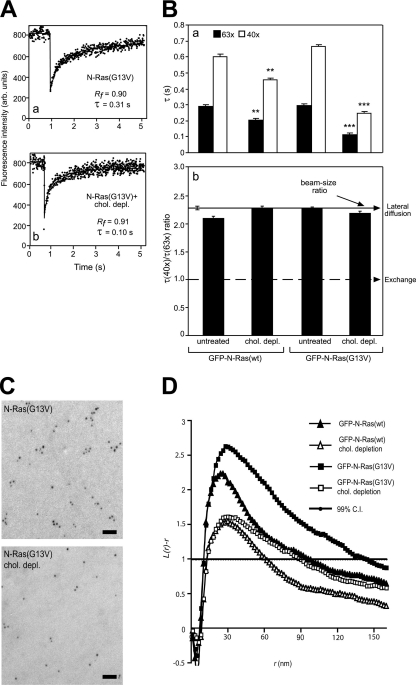
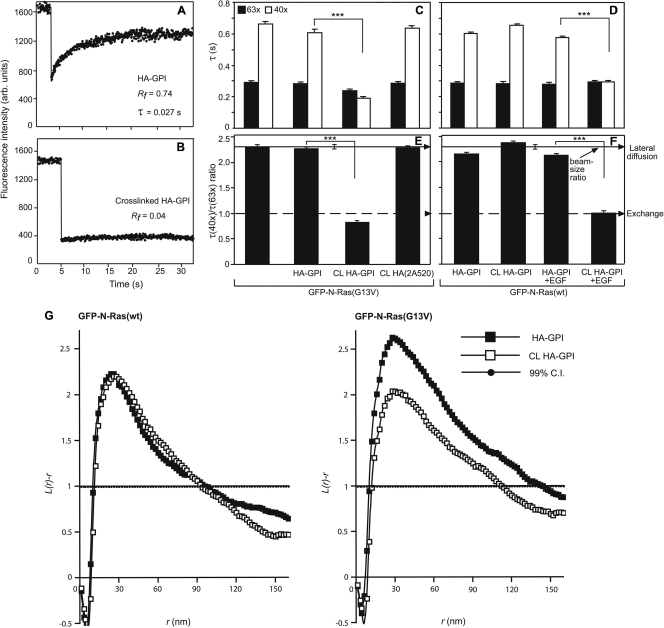
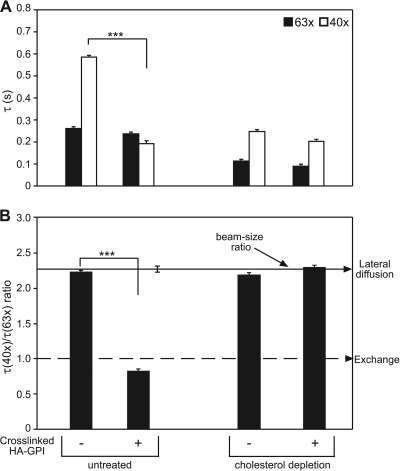
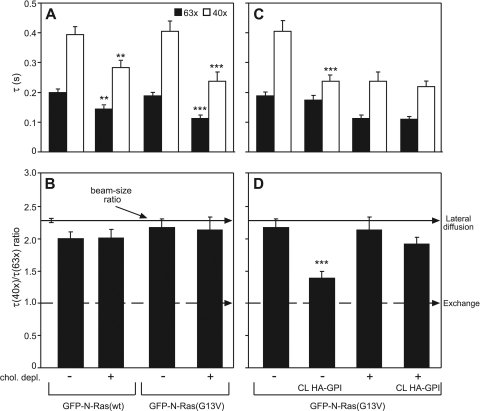
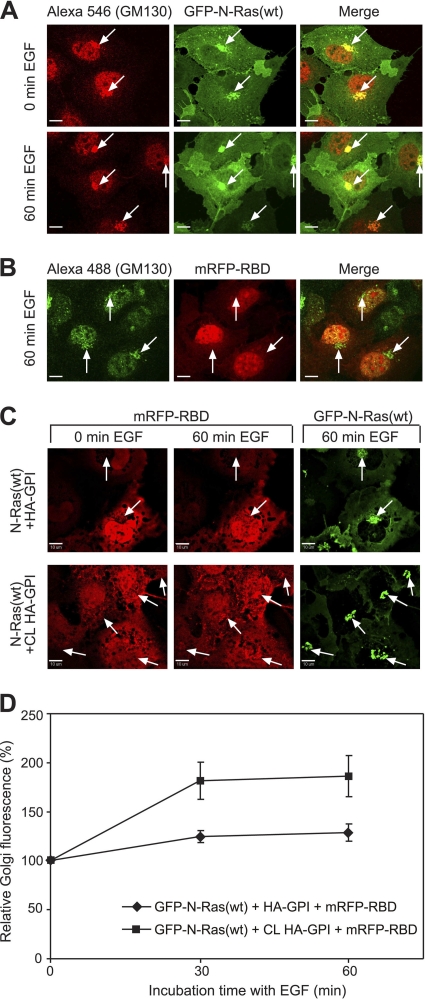
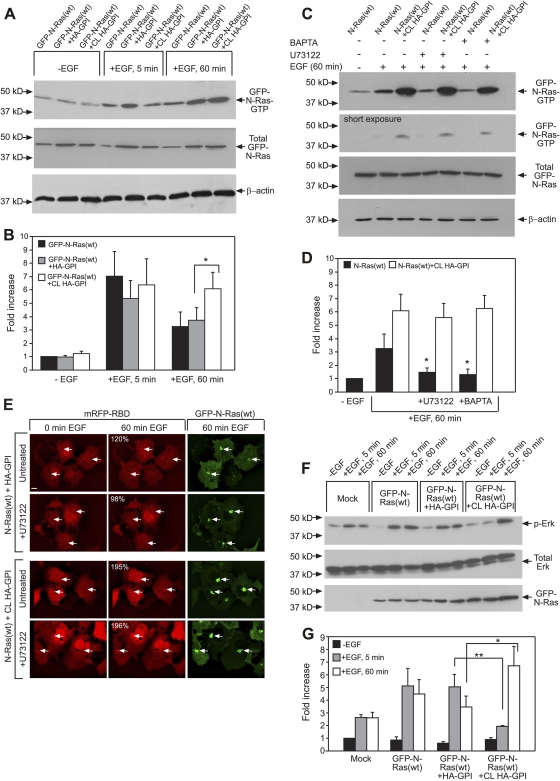
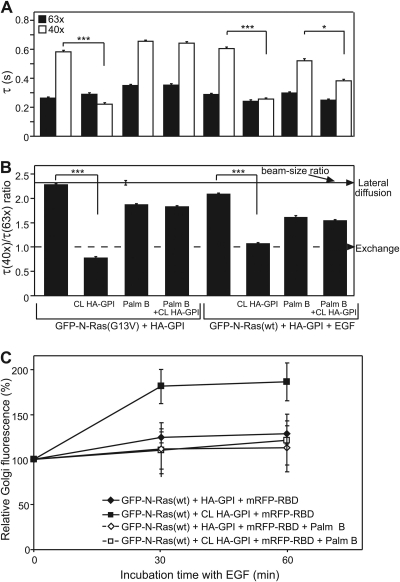
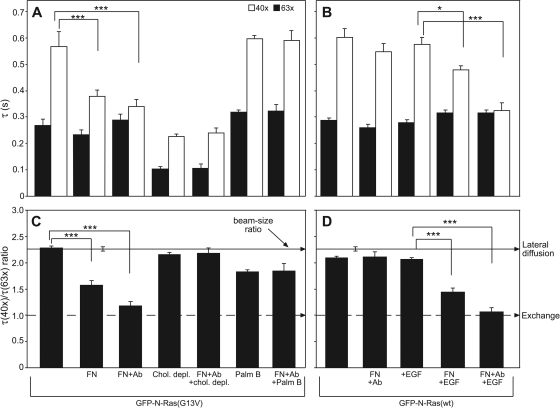
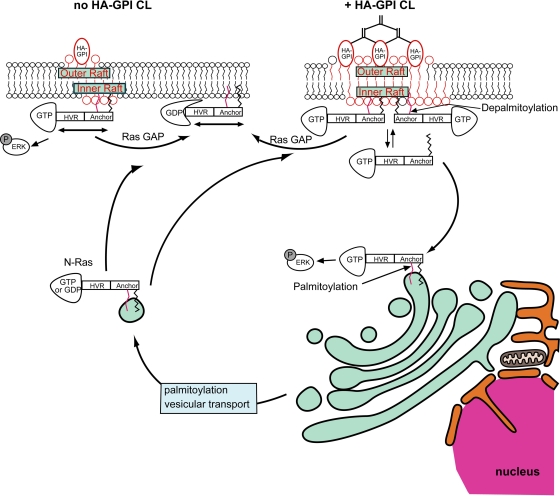
The trafficking, membrane localization, and lipid raft association of Ras proteins, which are crucial oncogenic mediators, dictate their isoform-specific biological responses. Accordingly, their spatiotemporal dynamics are tightly regulated. While extensively studied for H- and K-Ras, such information on N-Ras, an etiological oncogenic factor, is limited. Here, we report a novel mechanism regulating the activation-dependent spatiotemporal organization of N-Ras, its modulation by biologically relevant stimuli, and isoform-specific effects on signaling. We combined patching/immobilization of another membrane protein with fluorescence recovery after photobleaching (patch-FRAP) and FRAP beam size analysis to investigate N-Ras membrane interactions. Clustering of raft-associated proteins, either glycosylphosphatidylinositol-anchored influenza virus hemagglutinin (HA-GPI) or fibronectin receptors, selectively enhanced the plasma membrane-cytoplasm exchange of N-Ras-GTP (preferentially associated with raft domains) in a cholesterol-dependent manner. Electron microscopy (EM) analysis showed N-Ras-GTP localization in cholesterol-sensitive clusters, from which it preferentially detached upon HA-GPI cross-linking. HA-GPI clustering enhanced the Golgi compartment (GC) accumulation and signaling of epidermal growth factor (EGF)-stimulated N-Ras-GTP. Notably, the cross-linking-mediated enhancement of N-Ras-GTP exchange and GC accumulation depended strictly on depalmitoylation. We propose that the N-Ras activation pattern (e.g., by EGF) is altered by raft protein clustering, which enhances N-Ras-GTP raft localization and depalmitoylation, entailing its exchange and GC accumulation following repalmitoylation. This mechanism demonstrates a functional signaling role for the activation-dependent differential association of Ras isoforms with raft nanodomains.


Figures

Fig. 1.
Fig. 1.
FRAP beam size analysis and EM spatial mapping show preferential interactions of constitutively active N-Ras with cholesterol-sensitive assemblies in the PM. (A) Typical FRAP curves (63× objective, 22°C) of GFP–N-Ras(G13V) in untreated (a) or cholesterol-depleted (chol. depl.) (b) COS-7 cells. Solid lines, best fit of a nonlinear regression analysis (Materials and Methods). arb. units, arbitrary units. (B) FRAP beam size analysis. Bars show means ± standard errors of the means (SEM) of 30 to 60 measurements. The studies employed 40× and 63× objectives, yielding a 2.28 ± 0.17 (n = 59) beam size ratio. Thus, this τ(40×)/τ(63×) ratio is expected for FRAP by lateral diffusion (b, upper arrow). A τ ratio of 1 (b, lower arrow) indicates recovery by exchange (24). Comparison between τ values (a) measured with the same beam size showed that cholesterol depletion strongly reduced the τ values of GFP–N-Ras(G13V) (***, P < 10−8; Student's t test), with a mild effect on GFP–N-Ras(wt) (**, P < 10−3). Bootstrap analysis (Materials and Methods) showed that all τ ratios (panel b) are not significantly different from the 2.28 beam size ratio (P > 0.3), suggesting FRAP by lateral diffusion. Calculating D from the τ values before and after cholesterol depletion yielded values of D = 0.52 and 0.74 μm2/s for GFP–N-Ras(wt) and D = 0.51 and 1.35 μm2/s for GFP–N-Ras(G13V). (C) Representative EM images of PM sheets from untreated and cholesterol-depleted HeLa cells expressing GFP–N-Ras (G13V). Bars, 50 nm. (D) Mean univariate K functions of gold–anti-GFP expressed as L(r) − r standardized on the 99% confidence interval (C.I.). Positive deviation from this value indicates clustering for that r. Data were pooled from multiple (n ≥ 21) PM sheets. Cholesterol depletion significantly reduced both GFP–N-Ras(wt) and GFP–N-Ras(G13V) clustering; the effect was stronger for GFP–N-Ras(G13V) (P < 0.001; bootstrap analysis).
Fig. 2.
Fig. 2.
The results of patch-FRAP and EM demonstrate that cross-linking raft-resident HA-GPI reduces the PM association of activated N-Ras. COS-7 cells expressing GFP–N-Ras (wt or G13V) with or without HA-GPI (raft) or HA(2A520) (nonraft) were subjected to HA cross-linking (CL) at 4°C by IgGs or to TRITC-Fab′ labeling (control). For EGF stimulation (D and F), cells were serum starved, HA cross-linked, incubated (or not) with EGF (100 ng/ml, 4 min, 37°C), and subjected to FRAP studies at 22°C in EGF-containing buffer within 10 min. FRAP and EM studies were performed as described in the Fig. 1 legend. (A and B) Typical FRAP curves (63× objective) of HA-GPI without (A) or with (B) IgG cross-linking. (C to F) FRAP beam size analysis of GFP–N-Ras proteins. Bars show means ± SEM of 30 to 60 measurements. IgG cross-linking (CL) of HA-GPI but not of HA(2A520) dramatically reduced the τ(40×) (C and D) of activated (but not unactivated) N-Ras (***, P < 10−13; Student's t test). Bootstrap analysis of the τ ratios (E, F) showed that they are all similar (P > 0.3) to the 2.28 beam size ratio indicative of lateral diffusion, except for constitutively active or EGF-activated N-Ras in cells with cross-linked HA-GPI. In the latter cases, the τ ratios were ∼1, as predicted for FRAP by exchange (P > 0.06), highly different from their τ ratios without cross-linking (***, P < 10−20; bootstrap analysis). (G) EM spatial distribution analysis. HeLa cells coexpressing HA-GPI and GFP–N-Ras (wt or G13V) were pretreated as described above for HA-GPI cross-linking before generation of PM sheets and K function analysis (n ≥ 21). Only GFP–N-Ras (G13V) clustering was significantly reduced by HA-GPI cross-linking (P < 0.05; bootstrap analysis).
Fig. 3.
Fig. 3.
Cholesterol depletion abolishes the shift of GFP–N-Ras(G13V) to exchange by cross-linking HA-GPI. COS-7 cells coexpressing GFP–N-Ras(G13V) and HA-GPI were subjected (or not) to cholesterol depletion, followed by HA-GPI cross-linking (or Fab′ labeling; control). FRAP beam size analysis (22°C) was as described in the Fig. 2 legend. Bars depict means ± SEM (n = 30 to 60). The highly significant effects of HA-GPI cross-linking on the τ(40×) of N-Ras(G13V) (***, P < 10−13; Student's t test) (A) and on its τ ratio (***, P < 10−20; bootstrap analysis) (B) were abolished by cholesterol depletion.
Fig. 4.
Fig. 4.
The preferential interactions of activated N-Ras with rafts and its shift to exchange in response to HA-GPI cross-linking are retained at 37°C. COS-7 cells expressing GFP–N-Ras (wt or G13V) alone or with HA-GPI were subjected (or not) to cholesterol depletion, followed by HA-GPI cross-linking (or Fab′ labeling) and FRAP beam size analysis at 37°C as described in the Fig. 2 legend. Bars show means ± SEM (n = 30 to 60). (A and B) Effects of cholesterol depletion. Comparison between τ values (A) measured with the same beam size shows that cholesterol depletion significantly reduces the τ of GFP–N-Ras(G13V) (***, P < 10−8; Student's t test), with a milder effect on GFP–N-Ras(wt) (**, P < 10−5). (C and D) HA-GPI cross-linking induces a cholesterol-dependent shift of N-Ras(G13V) to exchange. The significant effects of HA-GPI cross-linking on the τ(40×) of N-Ras(G13V) (***, P < 10−8; Student's t test) (C) and on its τ ratio (***, P < 10−12; bootstrap analysis) (B) were abolished in cholesterol-depleted cells.
Fig. 5.
Fig. 5.
HA-GPI clustering enhances the accumulation of activated N-Ras in the Golgi compartment (GC) following EGF stimulation. COS-7 cells were transfected with GFP–N-Ras(wt) alone (A), mRFP-RBD alone (B), or both together with HA-GPI (C, D). They were serum starved, subjected (or not) to HA-GPI cross-linking at 4°C, and either left untreated (0 min EGF) or incubated at 37°C with 100 ng/ml EGF. Images were taken with a spinning-disk confocal microscope as described in Materials and Methods. Bars, 10 μm. (A) GFP–N-Ras and GM130 colocalization. After fixation (4% paraformaldehyde), cells were permeabilized (0.2% Triton X-100), labeled with rabbit anti-GM130 (0.2 μg/ml) and Alexa fluor 546–goat anti-rabbit IgG (3 μg/ml), and imaged at a plane with distinct GM130 GC labeling. Arrows point at GC staining (GM130 labeling) in GFP–N-Ras-expressing cells. (B) Endogenous Ras levels are insufficient to detect mRFP-RBD GC accumulation. The experiment was performed as described for panel A on cells transfected with mRFP-RBD. After stimulation with EGF (60 min), cells were fixed, permeabilized, and stained for GM130 using Alexa fluor 488–goat anti-rabbit IgG. Arrows indicate GM130 GC labeling in cells expressing mRFP-RBD. (C) Live- cell 3-D imaging of EGF-stimulated triple-transfected cells. Typical midplane images of cells at 0 and 60 min of EGF stimulation, without (top) or with (bottom row) HA-GPI cross-linking (CL). The GC was identified by the dense GFP–N-Ras fluorescence (arrows). (D) Quantification (means ± SEM, 9 to 10 cells) of the relative GC mRFP-RBD fluorescence in 3-D image stacks of live cells. The intensity in the GC at time zero was taken as 100%.
Fig. 6.
Fig. 6.
Cross-linking of HA-GPI differentially modulates GFP–N-Ras(wt) activation and signaling after short and long EGF stimulation. For biochemical assays (A to D, F, and G), COS-7 cells were transfected with GFP–N-Ras(wt), GFP–N-Ras(wt) plus HA-GPI, or empty vector (Mock). They were serum starved, subjected (or not) to HA-GPI cross-linking (CL), and/or stimulated with EGF, followed by GST-RBD pulldown and immunoblotting (see Materials and Methods). (A and B) Representative blots (A) and quantification (means ± SEM, n = 3) of the fold increase [relative to the results for unstimulated cells expressing GFP–N-Ras(wt)] in the ratio of GTP-bound to total GFP–N-Ras (transfection control) (B). β-Actin served as loading control. An asterisk indicates a significant difference between the results for similarly treated HA-GPI-expressing cells with or without cross-linking (P < 0.02; Student's t test). (B and C) Representative blots (C) and quantification (means ± SEM, n = 4) of the effects of BAPTA-AM (BAPTA) and U73122 on GFP–N-Ras–GTP pulldown (D). The inhibitors (or 0.1% DMSO; control) were added (30 min, 37°C, 10 μM) before HA-GPI cross-linking and retained. The inhibitors significantly reduced GFP–N-Ras–GTP in non-cross-linked cells stimulated with EGF (60 min) (black bars) (*, P < 0.02; Student's t test) but had no effect in cells subjected to HA-GPI cross-linking (white bars). The lack of effect of the inhibitors was validated by the results of short exposure of the blots (C, second panel). (E) Live-cell confocal analysis demonstrates no effect of U73122 on mRFP-RBD GC accumulation. Transfection and experimental details were as described in the Fig. 5C legend. Quantification of the relative percentages of GC accumulation of mRFP-RBD (upper left corner of the middle panels) was as described in the Fig. 5D legend, extracting the values from the cells indicated by the arrows pointing at the GC. The images show typical fields. Bar, 10 μm. Inhibition with BAPTA gave similar results (not shown). (F and G) Representative blots (F) and quantification of EGF-stimulated phospho-Erk (p-Erk) formation (means ± SEM, n = 4) normalized to total Erk (G). Results depict fold increase in calibrated p-Erk level relative to that in unstimulated control. Asterisks indicate significant differences between the results for HA-GPI-expressing cells with or without cross-linking after EGF stimulation, comparing samples stimulated with EGF for the same duration (*, P < 0.02; **, P < 0.004).
Fig. 7.
Fig. 7.
Effects of HA-GPI cross-linking on the PM interactions and GC accumulation of N-Ras–GTP are blocked by palmostatin B (Palm B). (A and B) Patch-FRAP studies. COS-7 cells were transfected with GFP–N-Ras (wt or G13V) plus HA-GPI, serum starved, and EGF stimulated (4 min) as described in the Fig. 2 legend. Palmostatin B (10 μM, 15 min, 37°C) was added prior to HA-GPI cross-linking (CL). DMSO (0.5%, control samples) had no effect. Palmostatin B at 50 μM yielded identical results. Bars, means ± SEM (n = 30 to 60). (A) τ values. Pairs of similarly treated cells expressing the same GFP–N-Ras protein with or without HA-GPI cross-linking were compared. The reduction in the τ(40×) of activated GFP–N-Ras induced by HA-GPI cross-linking (***, P < 10−12; Student's t test) was abolished by palmostatin B for N-Ras(G13V) (P > 0.6) and strongly compromised for EGF-stimulated N-Ras(wt) (*, P < 0.005). (B) τ(40×)/τ(63×) ratios. Bootstrap analysis showed that the significant effect of HA-GPI cross-linking on the τ ratio of activated N-Ras (***, P < 10−20) was abolished by palmostatin B (P > 0.12). (C) GC accumulation of GFP–N-Ras–GTP (means ± SEM, 9 to 10 cells per time point/condition). COS-7 cells triple transfected with GFP–N-Ras(wt), HA-GPI, and mRFP-RBD (see the Fig. 5 legend) were treated with palmostatin B as described above. EGF stimulation, 3-D live-cell imaging, and quantification of GC mRFP-RBD fluorescence were as described in the Fig. 5 legend.
Fig. 8.
Fig. 8.
Fibronectin (FN) binding to its surface receptors recapitulates the effects of HA-GPI clustering on GFP–N-Ras-PM interactions. FRAP beam size analysis (means ± SEM, n = 30 to 60) was performed on COS-7 cells expressing GFP–N-Ras (G13V or wt) as described in the Fig. 2 legend. (A and C) Fibronectin effects on GFP–N-Ras(G13V). Where indicated, cells were cholesterol depleted (as described in the Fig. 3 legend) or treated with palmostatin B (Palm B) (see the Fig. 7 legend). They were then incubated with fibronectin alone or followed by antifibronectin (+Ab [antibody]). (A) Fibronectin significantly reduced the τ(40×) of N-Ras(G13V), an effect augmented by antifibronectin (***, P < 10−12; Student's t test). These effects were abrogated by cholesterol depletion or palmostatin B (P > 0.1). (C) Concomitantly, fibronectin (with or without Ab) significantly reduced the τ ratios of GFP–N-Ras(G13V) (***, P < 10−12; bootstrap analysis). These effects were abolished by cholesterol depletion or palmostatin B (P > 0.4). (B and D) Fibronectin effects on GFP–N-Ras(wt). Cells were serum starved, incubated at 4°C with fibronectin followed by antifibronectin (+Ab), and stimulated by EGF (100 ng/ml, 4 min, 37°C) where indicated. Fibronectin or EGF stimulation alone did not affect the τ value or the τ ratio of N-Ras(wt); however, combining EGF with fibronectin cross-linking significantly reduced the τ(40×) (***, P < 10−12; *, P < 0.01 [Student's t test]) and the τ ratio (***, P < 10−12; bootstrap analysis).
Fig. 9.
Fig. 9.
A model for the modulation of N-Ras membrane interactions and PM/GC signaling by clustering raft proteins. The model depicts cells expressing N-Ras and HA-GPI as a representative raft-associated protein. Similar effects can be induced by clustering fibronectin receptors or other raft proteins. N-Ras interacts with the membrane mainly by the farnesyl (black) and single palmitoyl (red) residues at the C-terminal anchor; additional interactions (not shown) are provided by the hypervariable (HVR) region. N-Ras–GTP has preferential dynamic interactions with rafts (Fig. 1) in the inner leaflet (upper left; no HA-GPI cross-linking), from which most of its PM signaling (i.e., p-Erk formation) emanates. Cross-linking of (CL) raft proteins by IgG (HA-GPI) or ligands (e.g., fibronectin) clusters and stabilizes raft domains. This enhances the recruitment of N-Ras–GTP to raft clusters and increases its susceptibility to depalmitoylation, either by association with raft protein(s) that confer a topological orientation/conformation that is highly sensitive to depalmitoylation or by increased proximity to depalmitoylating enzymes. The depalmitoylation weakens the interactions of N-Ras–GTP with the PM, enhancing its PM-cytoplasm exchange (Fig. 2 to 4, 7, and 8). The depalmitoylated N-Ras–GTP diffuses through the cytoplasm and interacts with all cellular membranes. With time, repalmitoylation in the GC results in N-Ras–GTP accumulation in and signaling from the GC (Fig. 5 to 7). This mechanism links costimulation by ligands that cross-link raft proteins with the reshaping of the response of N-Ras to a primary stimulus (e.g., EGF).

References

    1. Agard D. A., Hiraoka Y., Shaw P., Sedat J. W. 1989. Fluorescence microscopy in three dimensions. Methods Cell Biol. 30:353–377 - PubMed
    1. Ahearn I. M., et al. 2011. FKBP12 binds to acylated H-ras and promotes depalmitoylation. Mol. Cell 41:173–185 - PMC - PubMed
    1. Ariotti N., et al. 2010. Epidermal growth factor receptor activation remodels the plasma membrane lipid environment to induce nanocluster formation. Mol. Cell. Biol. 30:3795–3804 - PMC - PubMed
    1. Baker T. L., Zheng H., Walker J., Coloff J. L., Buss J. E. 2003. Distinct rates of palmitate turnover on membrane-bound cellular and oncogenic H-ras. J. Biol. Chem. 278:19292–19300 - PubMed
    1. Belanis L., Plowman S. J., Rotblat B., Hancock J. F., Kloog Y. 2008. Galectin-1 is a novel structural component and a major regulator of H-Ras nanoclusters. Mol. Biol. Cell 19:1404–1414 - PMC - PubMed

Publication types

MeSH terms

LinkOut - more resources