Population dynamics and niche distribution of uropathogenic Escherichia coli during acute and chronic urinary tract infection
- PMID: 21807904
- PMCID: PMC3187256
- DOI: 10.1128/IAI.05339-11
Population dynamics and niche distribution of uropathogenic Escherichia coli during acute and chronic urinary tract infection
Abstract
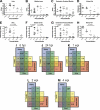
Urinary tract infections (UTIs) have complex dynamics, with uropathogenic Escherichia coli (UPEC), the major causative agent, capable of colonization from the urethra to the kidneys in both extracellular and intracellular niches while also producing chronic persistent infections and frequent recurrent disease. In mouse and human bladders, UPEC invades the superficial epithelium, and some bacteria enter the cytoplasm to rapidly replicate into intracellular bacterial communities (IBCs) comprised of ~10⁴ bacteria each. Through IBC formation, UPEC expands in numbers while subverting aspects of the innate immune response. Within 12 h of murine bladder infection, half of the bacteria are intracellular, with 3 to 700 IBCs formed. Using mixed infections with green fluorescent protein (GFP) and wild-type (WT) UPEC, we discovered that each IBC is clonally derived from a single bacterium. Genetically tagged UPEC and a multiplex PCR assay were employed to investigate the distribution of UPEC throughout urinary tract niches over time. In the first 24 h postinfection (hpi), the fraction of tags dramatically decreased in the bladder and kidney, while the number of CFU increased. The percentage of tags detected at 6 hpi correlated to the number of IBCs produced, which closely matched a calculated multinomial distribution based on IBC clonality. The fraction of tags remaining thereafter depended on UTI outcome, which ranged from resolution of infection with or without quiescent intracellular reservoirs (QIRs) to the development of chronic cystitis as defined by persistent bacteriuria. Significantly more tags remained in mice that developed chronic cystitis, arguing that during the acute stages of infection, a higher number of IBCs precedes chronic cystitis than precedes QIR formation.
Figures


Similar articles
-
Metabolic Requirements of Escherichia coli in Intracellular Bacterial Communities during Urinary Tract Infection Pathogenesis.mBio. 2016 Apr 12;7(2):e00104-16. doi: 10.1128/mBio.00104-16. mBio. 2016. PMID: 27073089 Free PMC article.
-
Kinetics of uropathogenic Escherichia coli metapopulation movement during urinary tract infection.mBio. 2012 Feb 7;3(1):e00303-11. doi: 10.1128/mBio.00303-11. Print 2012. mBio. 2012. PMID: 22318320 Free PMC article.
-
Detection of intracellular bacterial communities in human urinary tract infection.PLoS Med. 2007 Dec;4(12):e329. doi: 10.1371/journal.pmed.0040329. PLoS Med. 2007. PMID: 18092884 Free PMC article.
-
Host-pathogen checkpoints and population bottlenecks in persistent and intracellular uropathogenic Escherichia coli bladder infection.FEMS Microbiol Rev. 2012 May;36(3):616-48. doi: 10.1111/j.1574-6976.2012.00339.x. FEMS Microbiol Rev. 2012. PMID: 22404313 Free PMC article. Review.
-
Metabolic Adaptations of Uropathogenic E. coli in the Urinary Tract.Front Cell Infect Microbiol. 2017 Jun 8;7:241. doi: 10.3389/fcimb.2017.00241. eCollection 2017. Front Cell Infect Microbiol. 2017. PMID: 28642845 Free PMC article. Review.
Cited by
-
Uropathogenic Escherichia coli superinfection enhances the severity of mouse bladder infection.PLoS Pathog. 2015 Jan 8;11(1):e1004599. doi: 10.1371/journal.ppat.1004599. eCollection 2015 Jan. PLoS Pathog. 2015. PMID: 25569799 Free PMC article.
-
Virulence factors of uropathogens and their role in host pathogen interactions.Cell Surf. 2022 Feb 9;8:100075. doi: 10.1016/j.tcsw.2022.100075. eCollection 2022 Dec. Cell Surf. 2022. PMID: 35198842 Free PMC article.
-
Integrating mathematical models with experimental data to investigate the within-host dynamics of bacterial infections.Pathog Dis. 2019 Nov 1;77(8):ftaa001. doi: 10.1093/femspd/ftaa001. Pathog Dis. 2019. PMID: 31942996 Free PMC article. Review.
-
Massive diversification in aging colonies of Escherichia coli.J Bacteriol. 2014 Sep;196(17):3059-73. doi: 10.1128/JB.01421-13. Epub 2014 Jun 30. J Bacteriol. 2014. PMID: 24982303 Free PMC article.
-
Intracellular bacteria in the pathogenesis of Escherichia coli urinary tract infection in children.Clin Infect Dis. 2014 Dec 1;59(11):e158-64. doi: 10.1093/cid/ciu634. Epub 2014 Aug 4. Clin Infect Dis. 2014. PMID: 25091303 Free PMC article.
References
-
- Anderson G. G., et al. 2003. Intracellular bacterial biofilm-like pods in urinary tract infections. Science 301:105–107 - PubMed
Publication types
MeSH terms
Grants and funding
LinkOut - more resources
Full Text Sources
Other Literature Sources
Medical

