. 2011 Oct;55(10):4619-30.
doi: 10.1128/AAC.00182-11. Epub 2011 Aug 1.

Pharmacokinetic/pharmacodynamic (PK/PD) indices of antibiotics predicted by a semimechanistic PKPD model: a step toward model-based dose optimization

Affiliations

Pharmacokinetic/pharmacodynamic (PK/PD) indices of antibiotics predicted by a semimechanistic PKPD model: a step toward model-based dose optimization

Elisabet I Nielsen et al. Antimicrob Agents Chemother. 2011 Oct.

Abstract

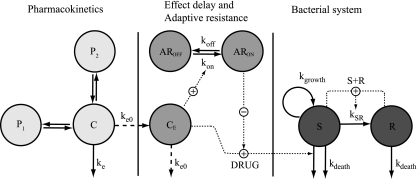
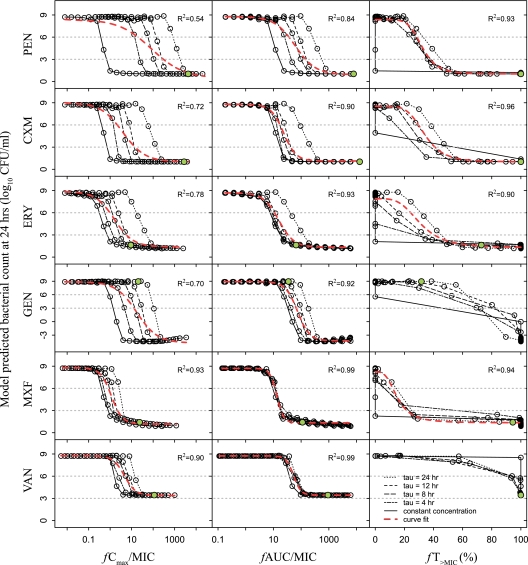
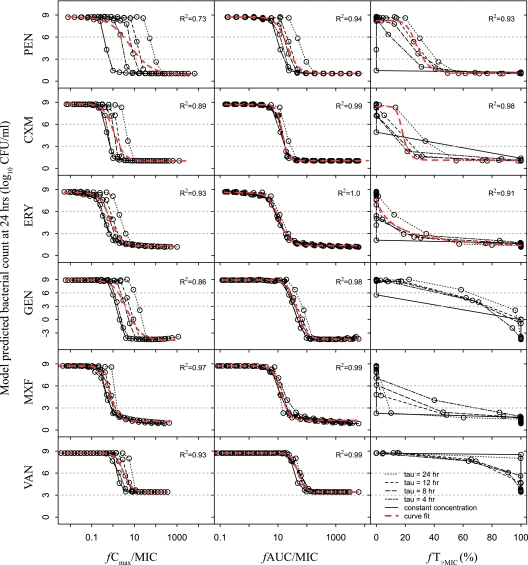
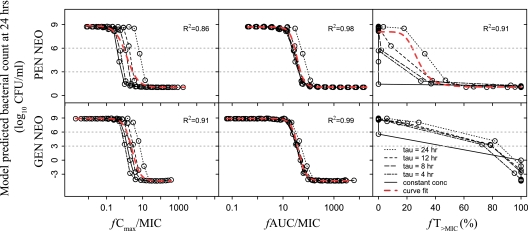
A pharmacokinetic-pharmacodynamic (PKPD) model that characterizes the full time course of in vitro time-kill curve experiments of antibacterial drugs was here evaluated in its capacity to predict the previously determined PK/PD indices. Six drugs (benzylpenicillin, cefuroxime, erythromycin, gentamicin, moxifloxacin, and vancomycin), representing a broad selection of mechanisms of action and PK and PD characteristics, were investigated. For each drug, a dose fractionation study was simulated, using a wide range of total daily doses given as intermittent doses (dosing intervals of 4, 8, 12, or 24 h) or as a constant drug exposure. The time course of the drug concentration (PK model) as well as the bacterial response to drug exposure (in vitro PKPD model) was predicted. Nonlinear least-squares regression analyses determined the PK/PD index (the maximal unbound drug concentration [fC(max)]/MIC, the area under the unbound drug concentration-time curve [fAUC]/MIC, or the percentage of a 24-h time period that the unbound drug concentration exceeds the MIC [fT(>MIC)]) that was most predictive of the effect. The in silico predictions based on the in vitro PKPD model identified the previously determined PK/PD indices, with fT(>MIC) being the best predictor of the effect for β-lactams and fAUC/MIC being the best predictor for the four remaining evaluated drugs. The selection and magnitude of the PK/PD index were, however, shown to be sensitive to differences in PK in subpopulations, uncertainty in MICs, and investigated dosing intervals. In comparison with the use of the PK/PD indices, a model-based approach, where the full time course of effect can be predicted, has a lower sensitivity to study design and allows for PK differences in subpopulations to be considered directly. This study supports the use of PKPD models built from in vitro time-kill curves in the development of optimal dosing regimens for antibacterial drugs.


Figures

Fig. 1.
Fig. 1.
Schematic illustration of the full semimechanistic PKPD model describing the time course of the drug concentration and the bacterial growth and killing after antibacterial treatment, as well as the development of adaptive resistance. C, central drug compartment; P1 and P2, peripheral drug compartments (P2 is used only for benzylpenicillin and gentamicin); CE, drug effect compartment; AROFF and ARON, compartments describing the development of adaptive resistance (only used for gentamicin); S, proliferating and drug-sensitive bacteria; R, resting and drug-insensitive bacteria; ke, drug elimination rate constant; ke0, rate constant for effect delay; kgrowth and kdeath, rate constants for multiplication and degradation of bacteria, respectively; kSR, rate constant for transformation from the growing, sensitive stage into the resting stage; kon, rate constant for the development of adaptive resistance; koff, rate constant for return to susceptibility. The effective drug concentration (CE) increases the death of bacteria in the drug-sensitive stage (S) according to a sigmoidal Emax function (DRUG). For gentamicin, CE also drives the resistance development (ARON), and ARON reduces the Emax parameter of the Emax function.
Fig. 2.
Fig. 2.
Relationship between the model-predicted bacterial count after 24 h of therapy (log10 CFU/ml at 24 h) and the pharmacodynamic indices (unbound Cmax/MIC ratio, unbound AUC/MIC ratio, and the percentage of time that the unbound drug plasma concentration exceed the MIC) after treatment with benzylpenicillin (PEN), cefuroxime (CXM), erythromycin (ERY), gentamicin (GEN), moxifloxacin (MXF), or vancomycin (VAN). Each simulated dosing regimen (i.e., dose and dosing interval) are represented by one data point in each panel. Included are the nonlinear least-squares regression line (dashed red line), the coefficient of determination (R2), and lines representing a bacteriostatic and bactericidal effect (horizontal dotted gray lines). The predictions for clinically commonly used dosing regimens (1,000 mg × 6, 750 mg × 3, 400 mg × 3, 315 mg × 1, 400 mg × 1, and 1,000 mg × 2 for benzylpenicillin, cefuroxime, erythromycin, gentamicin, moxifloxacin, and vancomycin, respectively) are indicated in green. tau, the dosing interval used in the simulations.
Fig. 3.
Fig. 3.
Relationship between the model-predicted bacterial count after 24 h of therapy and the pharmacodynamic indices (fCmax/MIC, fAUC/MIC, and fT>MIC) when a reduced CL (one-third of the original CL) was used in the simulation. Drugs: benzylpenicillin (PEN), cefuroxime (CXM), erythromycin (ERY), gentamicin (GEN), moxifloxacin (MXF), or vancomycin (VAN). Each simulated dosing regimen (i.e., dose and dosing intervals) are represented by one data point in each panel. Included are a nonlinear least-squares regression line (dashed red line), the coefficient of determination (R2), and lines representing a bacteriostatic and bactericidal effect (horizontal dotted gray lines).
Fig. 4.
Fig. 4.
Relationship between the model-predicted bacterial count after 24 h of therapy and the pharmacodynamic indices (fCmax/MIC, fAUC/MIC, and fT>MIC) for neonates (NEO) (gestational age, 30 weeks; postnatal age, 3 days). PEN, benzylpenicillin; GEN, gentamicin. Each simulated dosing regimen (i.e., dose and dosing intervals) is represented by one data point in each panel. Included are a nonlinear least-squares regression line (dashed red line), the coefficient of determination (R2), and lines representing bacteriostatic and bactericidal effects (horizontal dotted gray lines).

Similar articles

Cited by

References

    1. Ambrose P. G., et al. 2007. Pharmacokinetics-pharmacodynamics of antimicrobial therapy: it's not just for mice anymore. Clin. Infect. Dis. 44:79–86 - PubMed
    1. Ambrose P. G., et al. 2001. Pharmacodynamics of fluoroquinolones against Streptococcus pneumoniae in patients with community-acquired respiratory tract infections. Antimicrob. Agents Chemother. 45:2793–2797 - PMC - PubMed
    1. Andes D., Craig W. A. 2002. Animal model pharmacokinetics and pharmacodynamics: a critical review. Int. J. Antimicrob. Agents 19:261–268 - PubMed
    1. Andes D., Craig W. A. 2002. Pharmacodynamics of the new fluoroquinolone gatifloxacin in murine thigh and lung infection models. Antimicrob. Agents Chemother. 46:1665–1670 - PMC - PubMed
    1. Barbour A., Scaglione F., Derendorf H. 2010. Class-dependent relevance of tissue distribution in the interpretation of anti-infective pharmacokinetic/pharmacodynamic indices. Int. J. Antimicrob. Agents 35:431–438 - PubMed

Publication types

MeSH terms