. 2011 Aug 16;108(33):13823-8.
doi: 10.1073/pnas.1105115108. Epub 2011 Aug 1.

The Ca(V)3.3 calcium channel is the major sleep spindle pacemaker in thalamus

Affiliations

The Ca(V)3.3 calcium channel is the major sleep spindle pacemaker in thalamus

Simone Astori et al. Proc Natl Acad Sci U S A. .

Abstract

Low-threshold (T-type) Ca(2+) channels encoded by the Ca(V)3 genes endow neurons with oscillatory properties that underlie slow waves characteristic of the non-rapid eye movement (NREM) sleep EEG. Three Ca(V)3 channel subtypes are expressed in the thalamocortical (TC) system, but their respective roles for the sleep EEG are unclear. Ca(V)3.3 protein is expressed abundantly in the nucleus reticularis thalami (nRt), an essential oscillatory burst generator. We report the characterization of a transgenic Ca(V)3.3(-/-) mouse line and demonstrate that Ca(V)3.3 channels are indispensable for nRt function and for sleep spindles, a hallmark of natural sleep. The absence of Ca(V)3.3 channels prevented oscillatory bursting in the low-frequency (4-10 Hz) range in nRt cells but spared tonic discharge. In contrast, adjacent TC neurons expressing Ca(V)3.1 channels retained low-threshold bursts. Nevertheless, the generation of synchronized thalamic network oscillations underlying sleep-spindle waves was weakened markedly because of the reduced inhibition of TC neurons via nRt cells. T currents in Ca(V)3.3(-/-) mice were <30% compared with those in WT mice, and the remaining current, carried by Ca(V)3.2 channels, generated dendritic [Ca(2+)](i) signals insufficient to provoke oscillatory bursting that arises from interplay with Ca(2+)-dependent small conductance-type 2 K(+) channels. Finally, naturally sleeping Ca(V)3.3(-/-) mice showed a selective reduction in the power density of the σ frequency band (10-12 Hz) at transitions from NREM to REM sleep, with other EEG waves remaining unaltered. Together, these data identify a central role for Ca(V)3.3 channels in the rhythmogenic properties of the sleep-spindle generator and provide a molecular target to elucidate the roles of sleep spindles for brain function and development.


Conflict of interest statement

The authors declare no conflict of interest.

Figures
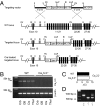
Fig. 1.
Fig. 1.
Gene targeting of the CaV3.3 locus. (A) Restriction enzyme map of the targeting vector, the WT locus, and the predicted mutant CaV3.3 allele following homologous recombination and after Cre deletion of the selection cassette in the finalized allele used to create mice. Only restriction sites relevant to the targeting strategy are indicated. The exon/intron numbering is as described in Mouse Genome Information (Vertebrate Genome Annotation). The sizes of exons and introns are not to scale. Restriction enzymes: B, BamHI; RI, EcoRI; RV, EcoRV; X, Xho1. Cassettes: βgeo, β-galactosidase-neomycin; E-I, EN2-SA-internal ribosomal entry site; MC1DTA, diphtheria toxin A fragment gene driven by an MC1 promoter; MC1TK, thymidine kinase gene; PGKneo, phosphoglycerol kinase-neomycin. (B) RT-PCR for CaV3.3 mRNA and β-actin from different brain areas, as indicated, in WT and CaV3.3/ mice. Crb, cerebellum; Ctx, cortex; OB, olfactory bulb; Thal, thalamus. (C) RT-PCR of thalamic CaV3.2 expression indicated as mean cycle of threshold differences between CaV3.2 and GAPDH mRNA (WT, n = 6; CaV3.3/, n = 6). (D) PCR analysis of tail DNA to identify WT, heterozygous, and homozygous animals. PCR primers used are identified in SI Materials and Methods.
Fig. 2.
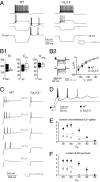
Fig. 2.
CaV3.3 T-type Ca2+ channel deletion impairs rebound bursting in nRt cells. (A) Representative discharge patterns in nRt cells of a WT and a CaV3.3/ mouse induced by step current injections from rest. (Inset) Protocol. (B1) Box-and-whisker plots of input resistance (Ri), membrane capacitance (Cm), and resting membrane potential (Vrmp) of nRt cells from WT mice (n = 8) and CaV3.3/ mice (n = 13). For each box, the midline indicates the median, and top and bottom lines indicate 90th and 10th percentiles, respectively; whiskers span maximal to minimal values (P > 0.05 in all cases). (B2) (Left) Current responses to increasing hyperpolarizing voltage steps. (Inset) Protocol. (Right) Average values of steady-state current (Iss) at voltages indicated (WT, n = 7; CaV3.3/, n = 6; P > 0.05). (C) Membrane voltage responses to −500-pA–step current injections from different holding potentials, as indicated. (D) Expanded traces from C (−60 mV). (E and F) Number of low-threshold Ca2+ spikes (E) and number of APs (F) within the first burst differed across a wide range of membrane potentials (WT, n = 8; CaV3.3/, n = 13; **P < 0.01).
Fig. 3.
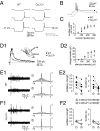
Fig. 3.
CaV3.3 deletion does not affect rebound discharge in TC cells but reduces intrathalamic synchronized network activity. (A) Representative traces of rebound bursting in TC cells. (Inset) Protocol. (B) Expanded overlay of traces shown in A (−250-pA steps). (C) The number of APs within the burst did not differ across the whole range of current injections tested (WT, n = 8; CaV3.3/, n = 7; P > 0.05). (D1) Synaptic responses evoked in TC cells by electrical stimulation in nRt. (Inset) Recording configuration. (D2) Synaptic responses in TC cells show a larger charge transfer in WT cells at the stimulus intensities at which responses could be evoked reliably (WT, n = 7; CaV3.3/, n = 6; P < 0.05). (E1) Representative multiunit discharges in nRt from WT mice. Circled numbers indicate Ca2+/Mg2+ in ACSF. Traces are aligned to stimulus artifacts. (E2) Oscillatory strength and duration of spindles were calculated from autocorrelograms as ratio of second to first peak and as time between 100% and 5% of the maximum, respectively. Values from single experiments (circles) and average values (horizontals bars) are displayed for the two ionic conditions (n = 7). (F1 and F2) As in E1 and E2 for CaV3.3/. In four of six cases, change in Ca2+/Mg2+ completely abolished oscillations.
Fig. 4.
Fig. 4.
CaV3.3 channels determine T-current characteristics in nRt cells. (A1) Families of isolated T currents evoked in WT and CaV3.3−/− cells. (Inset) Protocol. (A2) T-current density calculated by normalizing peak currents to cell capacitance (WT, n = 10; CaV3.3/, n = 8). (A3) Activation curve of T currents (estimated Vhalf = −70.4 ± 1.0 mV for WT vs. Vhalf = −63.6 ± 1.9 mV for CaV3.3/; n = 10 and 8, respectively). (B) Scaled-to-peak traces reveal faster decay kinetics in CaV3.3/ mice. Plot displays average values of τw, decay, calculated from double-exponential fit (WT, n = 10; CaV3.3/, n = 8). (C) (Left) Example of a recording of recovery from steady-state inactivation in a WT nRt cell, with the voltage-clamp protocol indicated below. (Right) Time course of recovery from inactivation, with T-current peaks normalized to that obtained for Δt = 10 s. Recovery time constants (τw, rec) were obtained from double-exponential fits (WT, n = 10; CaV3.3/, n = 8). (D) (Left) Representative traces of T currents with increasing Ni2+. (Right) Average time course shows higher sensitivity of CaV3.3/ cells to Ni2+ (WT, n = 6; CaV3.3/, n = 6). For all plots in this figure, **P < 0.01.
Fig. 5.
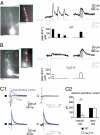
Fig. 5.
Impaired Ca2+ signaling in CaV3.3/ mice. (A) Example of [Ca2+]i transients (black) evoked in a WT nRt cell mediated by rebound bursting or tonic firing (gray). Fluorescent signals were collected in a dendritic region (enlarged image). The photograph of the fluorescent cell was taken at the end of the recording session and with increased illumination intensity. Bar graphs are aligned to raw traces and show summary data (n = 8) for each peak Δ[Ca2+]i for rebound bursting and tonic firing. (Scale bars: 5 μm.) (B) As in A, for a CaV3.3/ mouse (n = 8). In CaV3.3/ mice, only cells displaying rebound spiking were considered. **P < 0.01 compared with corresponding WT signal. (C1) SK2 currents evoked by voltage protocols shown in Insets. The last portions of a 125-ms voltage step and the following 500 ms are displayed. Control, black; apamin (Apa), gray; apamin-sensitive currents (blue) were generated by digital subtraction. (C2) Summary data (WT, n = 7; CaV3.3/, n = 9; **P < 0.01).
Fig. 6.
Fig. 6.
Selective reduction in EEG σ power in naturally sleeping CaV3.3/ mice. (A) Spectral analysis of the absolute EEG power between 0.75 and 20 Hz for NREM sleep. Dotted lines delineate δ (0.75–4 Hz) and σ (10–12 Hz) bands. (Inset) Mean absolute δ and σ power. (B) (Left) Example of traces of band pass-filtered (10–12 Hz) EEG recordings illustrating the surge of spindle power at NREM-to-REM sleep transitions. (Right) Zoom-in on the maximal σ activity before the transition. (C) Time course of mean EEG activity in the σ frequency band at NREM-to-REM sleep transitions. Data were normalized to the average σ power in the time window −3 to −1 min. Gray box indicates data points with significant difference (*P < 0.05) between groups. (Inset) Peak values of σ power at the surge before REM sleep onset. (D) Color-coded heat map of percent EEG power between 0.75–25 Hz (0.25-Hz bins) during the NREM-to-REM sleep transition. Contour lines connect levels of similar relative power in nine color–coded 20% increments. White dashed lines at time 0 indicate NREM/REM sleep border.

References

    1. Perez-Reyes E. Molecular physiology of low-voltage-activated T-type calcium channels. Physiol Rev. 2003;83:117–161. - PubMed
    1. Klöckner U, et al. Comparison of the Ca2+ currents induced by expression of three cloned α1 subunits, α1G, α1H and α1I, of low-voltage-activated T-type Ca2+ channels. Eur J Neurosci. 1999;11:4171–4178. - PubMed
    1. Lee JH, et al. Cloning and expression of a novel member of the low voltage-activated T-type calcium channel family. J Neurosci. 1999;19:1912–1921. - PMC - PubMed
    1. Talley EM, et al. Differential distribution of three members of a gene family encoding low voltage-activated (T-type) calcium channels. J Neurosci. 1999;19:1895–1911. - PMC - PubMed
    1. Broicher T, Kanyshkova T, Meuth P, Pape HC, Budde T. Correlation of T-channel coding gene expression, IT, and the low threshold Ca2+ spike in the thalamus of a rat model of absence epilepsy. Mol Cell Neurosci. 2008;39:384–399. - PubMed

Publication types

Substances

LinkOut - more resources