. 2011 Aug 16;108(33):13582-7.
doi: 10.1073/pnas.1108161108. Epub 2011 Aug 1.

Phasor approach to fluorescence lifetime microscopy distinguishes different metabolic states of germ cells in a live tissue

Affiliations

Phasor approach to fluorescence lifetime microscopy distinguishes different metabolic states of germ cells in a live tissue

Chiara Stringari et al. Proc Natl Acad Sci U S A. .

Abstract

We describe a label-free imaging method to monitor stem-cell metabolism that discriminates different states of stem cells as they differentiate in living tissues. In this method we use intrinsic fluorescence biomarkers and the phasor approach to fluorescence lifetime imaging microscopy in conjunction with image segmentation, which we use to introduce the concept of the cell phasor. In live tissues we are able to identify intrinsic fluorophores, such as collagen, retinol, retinoic acid, porphyrin, flavins, and free and bound NADH. We have exploited the cell phasor approach to detect a trend in metabolite concentrations along the main axis of the Caenorhabditis elegans germ line. This trend is consistent with known changes in metabolic states during differentiation. The cell phasor approach to lifetime imaging provides a label-free, fit-free, and sensitive method to identify different metabolic states of cells during differentiation, to sense small changes in the redox state of cells, and may identify symmetric and asymmetric divisions and predict cell fate. Our method is a promising noninvasive optical tool for monitoring metabolic pathways during differentiation or disease progression, and for cell sorting in unlabeled tissues.


Conflict of interest statement

The authors declare no conflict of interest.

Figures

Fig. 1.
Fig. 1.
Phasor analysis of FLIM tissue images. (A) Intensity image of a seminiferous tubule from a mice expressing GFP from an Oct4 transgene. (B) Map of the average lifetime τφ of the FLIM image. (C) τφ Histogram of the FLIM image is represented in gray. Colored areas correspond to τφ of each tissue component identified by the phasor analysis. (D) Phasor histogram of the FLIM image. The line color (from blue to purple formula image
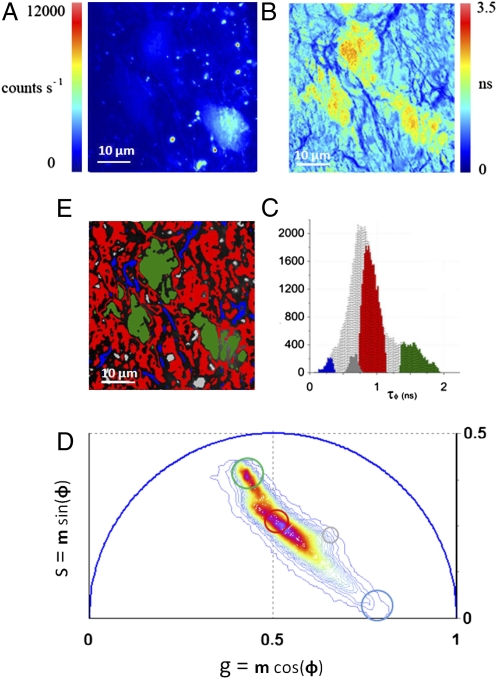
) corresponds to the 64 levels of the contours that indicate the percent occurrence in the phasor histogram of the pixels of the image. Four clusters corresponding to different tissue components are identified in the phasor distribution with different colors. (E) Phasor color maps of the FLIM image. The colors of pixels correspond to the clusters of tissue components selected in the phasor plot.
Fig. 2.
Fig. 2.
Phasors of pure chemical species identify tissue components. (A) Phasor location of pure chemical species: GFP, retinol in DMSO, retinoic acid in DMSO, FAD, free NADH, bound NADH with lactate dehydrogenase, and protoporphyrin IX. Color scale defined in Fig. 1D. (B) Intensity image of a seminiferous tubule from a mice expressing GFP from an Oct4 transgene. A chain of spermatogonial stem cells lie on the surface of the seminiferous tubule. (C) Phasor plot of the FLIM image acquired in B. The color scale of the phasor plot histogram was defined in Fig. 1D. The green and the blue cluster are located in the phasor position of pure GFP and pure collagen clusters. (D) Phasor color map. Green and blue pixels contain mostly GFP and collagen.
Fig. 3.
Fig. 3.
Maps of relative concentration of tissue components. (A) Phasor plot of the FLIM image (color scale defined in Fig. 1D). Different clusters are assigned to pure chemical species according to Fig. 2A: GFP, 1; average tissue autofluorescence, 2; collagen, 3; retinol, 4; and retinoic acid, 5. (B) Phasor plot selection using a linear cluster combination that represents all of the possible relative concentrations of GFP and the average autofluorescence, autofluorescence and collagen, and retinol and retinoic acid, respectively. Each point along the line has a color corresponding to specific fractional intensity of the species. (C) Intensity image of a seminiferous tubule from a mice expressing GFP from an Oct4 transgene. (D–F) Maps of relative concentrations of: GFP and autofluorescence (D), autofluorescence and collagen (E), retinol and retinoic acid (F). Pixels in the images are highlighted with the same color scale of the phasor plot. Arrows indicate germ cells with a lower concentration of GFP with respect to autofluorescence.
Fig. 4.
Fig. 4.
Identification of metabolic states of germ cells during differentiation. Fluorescence intensity image of a C. elegans germ line (A) excited at 740 nm and (B) excited at 880 nm. Histone-GFP fusion protein identifies the position and differentiation state of the germ cells that are indicated with different colors: distal mitotic region (blue), proximal mitotic region (red), transition zone (green), and meiotic pachytene (cyan). A red cursor of 5-μm diameter selects the region of interest of a germ cell in the intensity image at (C) 880 nm and (D) 740 nm. (E) Phasor plot of the FLIM image excited at 740 nm (color scale defined in Fig. 1D). (F) Scatter plot of the cell phasor of all germ cells excited at 740 nm. Every cell phasor (squares) is represented with a color that corresponds to its differentiation state in B. The distribution of distal mitotic cells in blue (blue, n = 14), proximal mitotic region (red, n = 20), transition zone cells (green, n = 83) are clearly separated. The mean values of clusters are represented by the colored stars and the SD by the dotted lines. (G) Scatter plot of the mean values of cell phasor distributions in distal mitotic region (blue), proximal mitotic region (red), and transition zone (green) for n = 6 independent C. elegans germ line. Independent samples are represented with different symbols. (H) Scatter plot of the mean values of the cell phasor distributions for n = 6 independent germ lines. Each sample is translated in the phasor plot as to make all of the distal mitotic region values coincident. The SDs of the proximal mitotic region and transition zone are represented by the dotted lines. (I) Zoomed image of the mitotic region of the C. elegans germ line excited at 880 nm in B. Cells are numbered in a distal to proximal direction. Blue cells belong to the distal mitotic region and red cells belong to the proximal mitotic region. (J) Scatter plot of the phasor average values of the 20 germ cells indicated in I.

Similar articles

Cited by

References

    1. Donovan PJ, Gearhart J. The end of the beginning for pluripotent stem cells. Nature. 2001;414(6859):92–97. - PubMed
    1. Knoblich JA. Asymmetric cell division during animal development. Nat Rev Mol Cell Biol. 2001;2(1):11–20. - PubMed
    1. Morrison SJ, Kimble J. Asymmetric and symmetric stem-cell divisions in development and cancer. Nature. 2006;441:1068–1074. - PubMed
    1. Morrison SJ, Spradling AC. Stem cells and niches: Mechanisms that promote stem cell maintenance throughout life. Cell. 2008;132:598–611. - PMC - PubMed
    1. Pera MF, Tam PP. Extrinsic regulation of pluripotent stem cells. Nature. 2010;465:713–720. - PubMed

Publication types