. 2011 Aug 16;108(33):13534-9.
doi: 10.1073/pnas.1109263108. Epub 2011 Aug 1.

Super-resolution microscopy reveals that mammalian mitochondrial nucleoids have a uniform size and frequently contain a single copy of mtDNA

Affiliations

Super-resolution microscopy reveals that mammalian mitochondrial nucleoids have a uniform size and frequently contain a single copy of mtDNA

Christian Kukat et al. Proc Natl Acad Sci U S A. .

Abstract

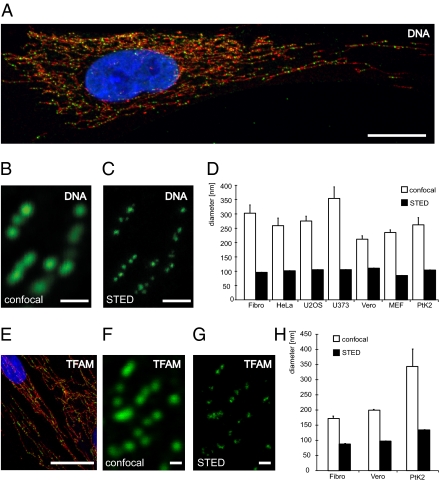
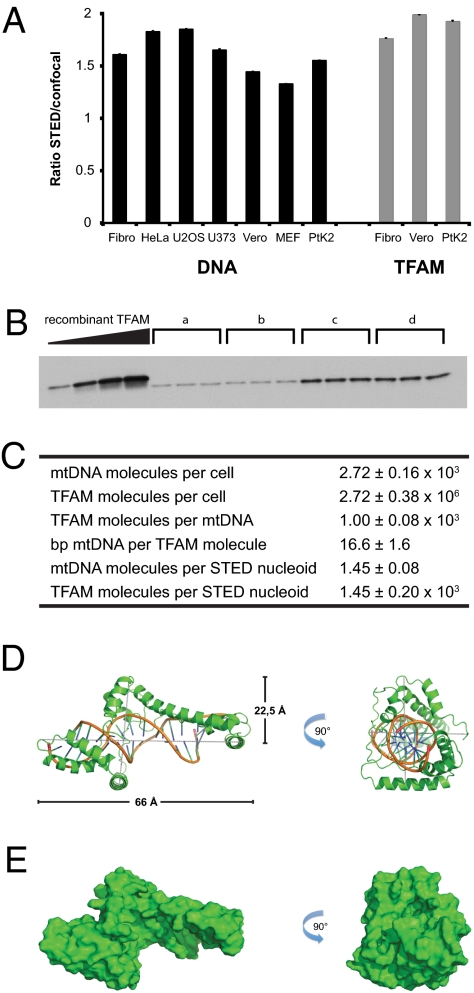
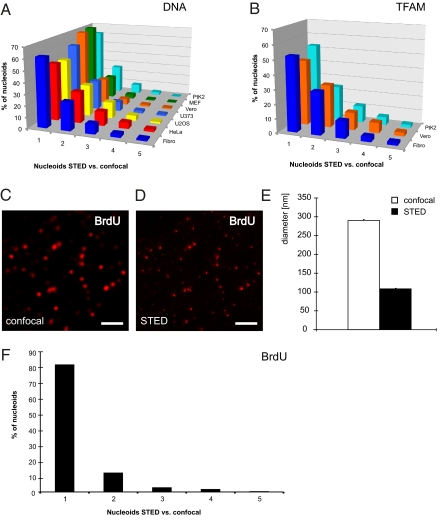
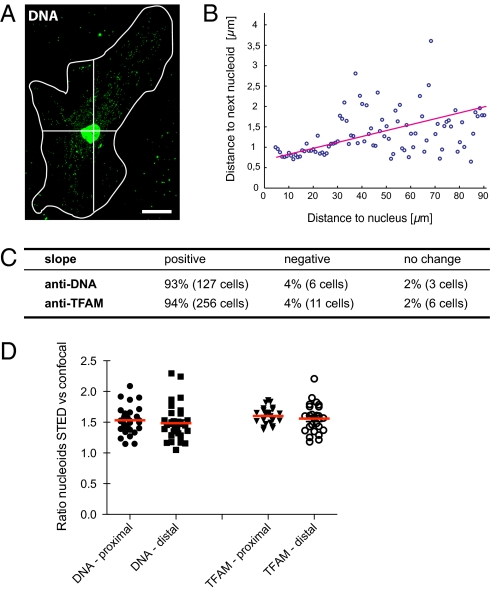
Mammalian mtDNA is packaged in DNA-protein complexes denoted mitochondrial nucleoids. The organization of the nucleoid is a very fundamental question in mitochondrial biology and will determine tissue segregation and transmission of mtDNA. We have used a combination of stimulated emission depletion microscopy, enabling a resolution well below the diffraction barrier, and molecular biology to study nucleoids in a panel of mammalian tissue culture cells. We report that the nucleoids labeled with antibodies against DNA, mitochondrial transcription factor A (TFAM), or incorporated BrdU, have a defined, uniform mean size of ∼100 nm in mammals. Interestingly, the nucleoid frequently contains only a single copy of mtDNA (average ∼1.4 mtDNA molecules per nucleoid). Furthermore, we show by molecular modeling and volume calculations that TFAM is a main constituent of the nucleoid, besides mtDNA. These fundamental insights into the organization of mtDNA have broad implications for understanding mitochondrial dysfunction in disease and aging.


Conflict of interest statement

The authors declare no conflict of interest.

Figures

Fig. 1.
Fig. 1.
The nucleoid has a uniform mean size in mammalian cells. (A) mtDNA (green, DNA antibodies) is localized in nucleoids in the tubular mitochondria (red, anti-TOM20) of human fibroblasts. DAPI-staining of nucleus in blue. (B) Using confocal microscopy, nucleoids labeled with an antiserum against DNA appear to be solid structures with an average diameter of ∼300 nm in human fibroblasts. (C) Applying super-resolution STED microscopy, we found that the apparent nucleoids, as detected by confocal microscopy, frequently are agglomerates of several smaller structures, each with an average diameter of ∼99 nm. The section shown is the same as the one in B. (D) Sizes of nucleoids labeled with a DNA antibody determined by confocal and STED imaging in mammalian cell lines, such as, human primary culture fibroblasts (Fibro), human cervix adenocarcinoma cells (HeLa), human osteosarcoma cells (U2OS), human glioblastoma cells (U373), mouse embryonic fibroblasts (MEF), African green monkey kidney epithelial cells (Vero), and potoroo kidney cells (PtK2). The indicated sizes denote the antibody labeled nucleoids. (E) TFAM (green, anti-TFAM) is located in nucleoids in the mitochondrial network (red, anti-TOM20) of human fibroblasts. Nuclear DAPI-staining in blue. (F) Using confocal microscopy, the nucleoids labeled with an antiserum against TFAM appear in a punctuate pattern. (G) STED microscopy reveals a mean diameter of ∼88 nm for nucleoids labeled with a TFAM antibody in human fibroblasts. The section shown is the same as the one in F. (H) Quantification of the sizes of nucleoids labeled with TFAM antibodies determined by confocal and STED imaging in three mammalian cell lines. Error bars indicate SEM. (Scale bars: 20 μm in A and E, 0.5 μm in B, C, F, and G.)
Fig. 2.
Fig. 2.
Combination of molecular biology methods and super-resolution microscopy. (A) Ratio of the number of nucleoids detected by STED microscopy versus the number of nucleoids detected by confocal microscopy. Black bars: labeling with an antiserum against DNA; gray bars: labeling with an antiserum against TFAM. (B) Representative quantitative Western blot measurement of endogenous TFAM protein levels in human fibroblasts. “a” to “d” indicate protein extracts in triplicates from a determined number of cells. His-tagged, purified recombinant TFAM was used as standard in known concentrations (16.5, 33, 49.5, and 66 ng). (C) Table displaying the results of the quantitative real-time PCR, the quantitative Western blots and the resulting ratios of combining molecular biology methods with super-resolution microscopy. (D) Overall predicted structure of human TFAM bound to DNA. A cartoon representation shows TFAM in green and DNA by element with backbone in orange. (E) Surface representation of human TFAM bound to DNA. The solvent accessible surface is shown in green and has the same orientations as in D. Errors and error bars indicate SEM.
Fig. 3.
Fig. 3.
Nucleoids are frequently distributed in clusters. (A) Ratio of the number of DNA antibody-labeled nucleoids that were detected with STED microscopy versus those detected by confocal microscopy. The numbers denote the quantity of nucleoids detected by STED microscopy in a confocally assigned nucleoid. (B) Cells labeled with an antiserum against TFAM analyzed as in A. (C) Confocal imaging of BrdU-stained nucleoids in human fibroblasts after 60 min of BrdU incubation. (Scale bar, 2 μm.) (D) STED micrograph of the same section as in C. (Scale bar, 2 μm.) (E) Sizes of nucleoids in human fibroblasts labeled with BrdU antibodies and imaged by confocal and STED microscopy. (F) Cells treated for 60 min with BrdU and labeled with an antiserum against BrdU analyzed as in A. Error bars indicate SEM.
Fig. 4.
Fig. 4.
Nucleoid distribution as a function of the distance to the nucleus. (A) Representative cell labeled with an antiserum against DNA used for the analysis presented in B. The white line denotes the cell border; the cross indicates the center (nucleus) of the cell. (Scale bar, 20 μm.) (B) Plot of the nearest neighbor distance of individual nucleoids as depending of the distance from the nucleus. The circles represent 100 equally spaced bins, all together representing 986 nucleoids. (C) Table summarizing the analysis of altogether 409 cells as exemplified in A and B. (D) Ratio of the number of nucleoids labeled with DNA or TFAM antibodies detected by STED microscopy versus the number of nucleoids detected by confocal microscopy in dependence of the relative cellular location.

References

    1. Lang BF, et al. An ancestral mitochondrial DNA resembling a eubacterial genome in miniature. Nature. 1997;387:493–497. - PubMed
    1. Nass S, Nass MM. Intramitochondrial fibers with DNA characteristics. Ii. Enzymatic and other hydrolytic treatments. J Cell Biol. 1963;19:613–629. - PMC - PubMed
    1. Nass MM. Mitochondrial DNA. I. Intramitochondrial distribution and structural relations of single- and double-length circular DNA. J Mol Biol. 1969;42:521–528. - PubMed
    1. Anderson S, et al. Sequence and organization of the human mitochondrial genome. Nature. 1981;290:457–465. - PubMed
    1. Bibb MJ, Van Etten RA, Wright CT, Walberg MW, Clayton DA. Sequence and gene organization of mouse mitochondrial DNA. Cell. 1981;26(2 Pt 2):167–180. - PubMed

Publication types

LinkOut - more resources