. 2011 Aug 30;108(35):14467-72.
doi: 10.1073/pnas.1105845108. Epub 2011 Aug 1.

Temporary increase in plasma membrane tension coordinates the activation of exocytosis and contraction during cell spreading

Affiliations

Temporary increase in plasma membrane tension coordinates the activation of exocytosis and contraction during cell spreading

Nils C Gauthier et al. Proc Natl Acad Sci U S A. .

Abstract

Cell migration and spreading involve the coordination of membrane trafficking, actomyosin contraction, and modifications to plasma membrane tension and area. The biochemical or biophysical basis for this coordination is however unknown. In this study, we show that during cell spreading, lamellipodia protrusion flattens plasma membrane folds and blebs and, once the plasma membrane area is depleted, there is a temporary increase in membrane tension by over twofold that is followed by activation of exocytosis and myosin contraction. Further, an artificial increase in plasma membrane tension stopped lamellipodia protrusion and activated an exocytotic burst. Subsequent decrease in tension restored spreading with activation of contraction. Conversely, blebbistatin inhibition of actomyosin contraction resulted in an even greater increase in plasma membrane tension and exocytosis activation. This spatiotemporal synchronization indicates that membrane tension is the signal that coordinates membrane trafficking, actomyosin contraction, and plasma membrane area change. We suggest that cells use plasma membrane tension as a global physical parameter to control cell motility.


Conflict of interest statement

The authors declare no conflict of interest.

Figures

Fig. 1.
Fig. 1.
Exocytosis and contraction activations are synchronized during spreading. (A) One example of a typical fibroblast cell analyzed for its exocytic behavior (TIR-FM) during spreading. (see also Movie S1) (Scale bar: 10 μm.) (B) Example of single Golgi vesicle exocytosis analyzed by TIR-FM. (C) Motility map of the cell. The cell perimeter is plotted as a function of time and the color range shows the local protrusive or retractile behavior of the edge. The map clearly shows the transition between the fast noncontractile spreading P1 (first 2–3 min) and the contractile spreading P2 (dashed line). (D) Spread area and exocytic events per minute plotted as a function of time. (E) Same results but the numbers of exocytic events per minute are plotted as a function of spread area to outline the sharp transition between P1 and P2. The number of exocytic events was fewer than one per minute before phase transition but increased to 13 ± 3.2 events per minute after 10 min of spreading (n = 4 cells). (F) Brightfield images of the cell analyzed in G and H (see also Movie S2). The arrow shows the loss of edge cohesion when cell enters P2. (Scale bar: 5 μm.) (G) Motility map of the cell. (H) Analysis of the fluorescence intensity of the cells in the TIR-FM field during spreading (FM1-43 secretion by exocytosis) plotted as a function of spread area. This experiment was reproduced two times and the three cells presenting the same type of motility presented the same exocytic behavior.
Fig. 2.
Fig. 2.
Plasma membrane area depletion precedes exocytosis and contraction activation. (A) Time sequence of a representative cell during spreading analyzed with DIC (Upper) and FM1-43 epifluorescence (Lower). The dashed box outlines the membrane buffer region depicted in D. The dashed circle represents the membrane buffer region analyzed in E. The images are extracted from Movie S3. (Scale bar: 10 μm.) (B) Motility map of the cell depicted in A. The dashed line represents the transition between P1 and P2. (C) FM1-43 fluorescence intensity representing membrane exocytosis at each time point (10 s) is plotted versus the spread area to outline the sharp transition between P1 and P2. All the cells with a clear P1–P2 transition also had a clear and sharp exocytosis activation (n = 31 cells from 12 independent experiments). (D) Time sequence (10 s) of the dashed box d showing the membrane buffer depletion during P1. (E) Fluorescence intensity analysis of the different parts of the cell depicted in A showing that the apparent constant membrane area observed during P1 (whole cell fluorescence, black) is due to the unfolding of a membrane buffer (buffer region, red) that provides excess membrane area to the rest of the cell (whole cell–buffer, blue). Note that the fluorescence intensity lost in the buffer region (-0.52 a.u.) is similar to the gain in the rest of the cell (+0.54 a.u.). (F) Time-lapse 3D reconstruction of the PM during spreading using FM1-43 (see also Movie S5). Arrowhead points to the membrane folds and white arrows to the blebs. Folds and blebs disappear before the cell enters P2 phase, where contraction signs (ruffling) appear at the edge (blue arrows).
Fig. 3.
Fig. 3.
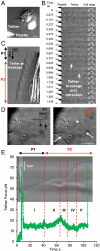
The PM tension increases as the cell starts to contract. (A) A representative cell visualized by DIC microscopy. The tether is the thin tube of membrane between the pipette and the edge of the cell. The dashed line represents the portion of the edge analyzed by the kymograph in C. The image is extracted from Movie S6. (Scale bar: 10 μm.) (B) Time sequence showing tether breakage at the transition between P1 and P2. (C) Kymograph of the edge outline in A showing the periodic contraction which characterizes the beginning of P2. The total time represents 612 s. (D) Cell morphology in P1 (Left) and P2 (Right) during laser tweezers experiment. The dashed line represents the portion of the edge analyzed by the kymograph in E. Dark arrowhead point to the tether, dark arrow to the trap bead. White arrowhead points to the wave of material moving backward observable in DIC and also observable in E at the back of the leading edge, sign of the contraction. The white arrows point to two ruffles, also a clear sign of contraction activation. (E) Composite figure of tether force (graph) and kymograph of the cell edge (blue line) at the P1 to P2 transition. The spike in force at the beginning represents the force needed to extract the tether from the edge. After stabilization (step I), the tether force increased (step II), decreased (step III) to stabilize again at a lower value than previously (step I compared to step IV), and increased again when the edge started to slow down a second time (step V). At this point, the bead was released from the trap to verify that the tether was still there.
Fig. 4.
Fig. 4.
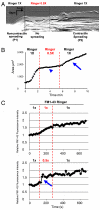
Hypotonically induced increase and subsequent decrease in membrane tension induces P1–P2 transition with activation of exocytosis and contraction. (A) Kymograph analysis of a DIC movie for a representative cell in P1 that is exposed to hypotonic medium for30 s (ringer 0.5×, lamellipodia protrusion stops) and subsequently restored to isotonic ringer (spreading resumes with a contractile lamellipodia presenting cycles of protrusion–contraction). The cell analyzed is presented in the bottom left corner of Movie S14 with three other cells with similar behavior. (B) Plot of the cell area versus time showing the strong effect of the temporary increase in plasma membrane tension on the overall spread area for the cell depicted in A. When PM tension increases (arrowhead) the cell stops spreading; spreading is resumed during the isotonic recovery phase (arrow). (C) The increase in membrane tension activates the exocytosis (lower graph, blue arrow). FM1-43 fluorescence is plotted as a function of time for a representative control cell (Upper) and for a cell exposed to hypotonic media (Lower). The PM area addition induced by hypotonicity was 37 ± 7% of the original PM area in 15 s (SEM, n = 6 cells).
Fig. 5.
Fig. 5.
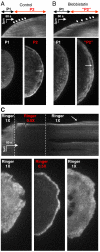
Actin dynamics correlated with spreading behavior. (A) Characteristic kymograph analysis of GFP-actin in TIR-FM (upper picture, see also Movie S16). Arrows point to the periodic contractions easily identified by the actin buckling at the beginning of P2. Total time is 350 s. Lower pictures present the actin morphology at the leading edge in P1 and P2. Arrow points again to the buckling. (B) Same analysis for a characteristic blebbistatin treated cell (see also Movie S16). (C) Same analysis as in A and B but for a cell with an hypotonically induced increase and subsequent decrease in membrane tension (see also Movie S17). Arrow points to the actin polymerization pushing forward the leading edge after isotonicity restoration. Lower pictures present the typical actin morphology at the leading edge during the experiment.

Comment in

  • Membrane tension leads the way.
    Keren K. Keren K. Proc Natl Acad Sci U S A. 2011 Aug 30;108(35):14379-80. doi: 10.1073/pnas.1111671108. Epub 2011 Aug 23. Proc Natl Acad Sci U S A. 2011. PMID: 21873200 Free PMC article. No abstract available.

References

    1. Apodaca G. Modulation of membrane traffic by mechanical stimuli. Am J Physiol Renal Physiol. 2002;282:F179–190. - PubMed
    1. Morris CE, Homann U. Cell surface area regulation and membrane tension. J Membr Biol. 2001;179:79–102. - PubMed
    1. Sheetz MP. Cell control by membrane-cytoskeleton adhesion. Nat Rev Mol Cell Biol. 2001;2:392–396. - PubMed
    1. Sheetz MP, Sable JE, Dobereiner HG. Continuous membrane-cytoskeleton adhesion requires continuous accommodation to lipid and cytoskeleton dynamics. Annu Rev Biophys Biomol Struct. 2006;35:417–434. - PubMed
    1. Kell A, Glaser RW. On the mechanical and dynamic properties of plant cell membranes: Their role in growth, direct gene transfer and protoplast fusion. J Theor Biol. 1993;160:41–62.

Publication types