

Dendritic Cells (DC) Facilitate Detachment of Squamous Carcinoma Cells (SCC), While SCC Promote an Immature CD16(+) DC Phenotype and Control DC Migration
- PMID: 21809059
- PMCID: PMC3601220
- DOI: 10.1007/s12307-011-0077-4
Dendritic Cells (DC) Facilitate Detachment of Squamous Carcinoma Cells (SCC), While SCC Promote an Immature CD16(+) DC Phenotype and Control DC Migration
Abstract
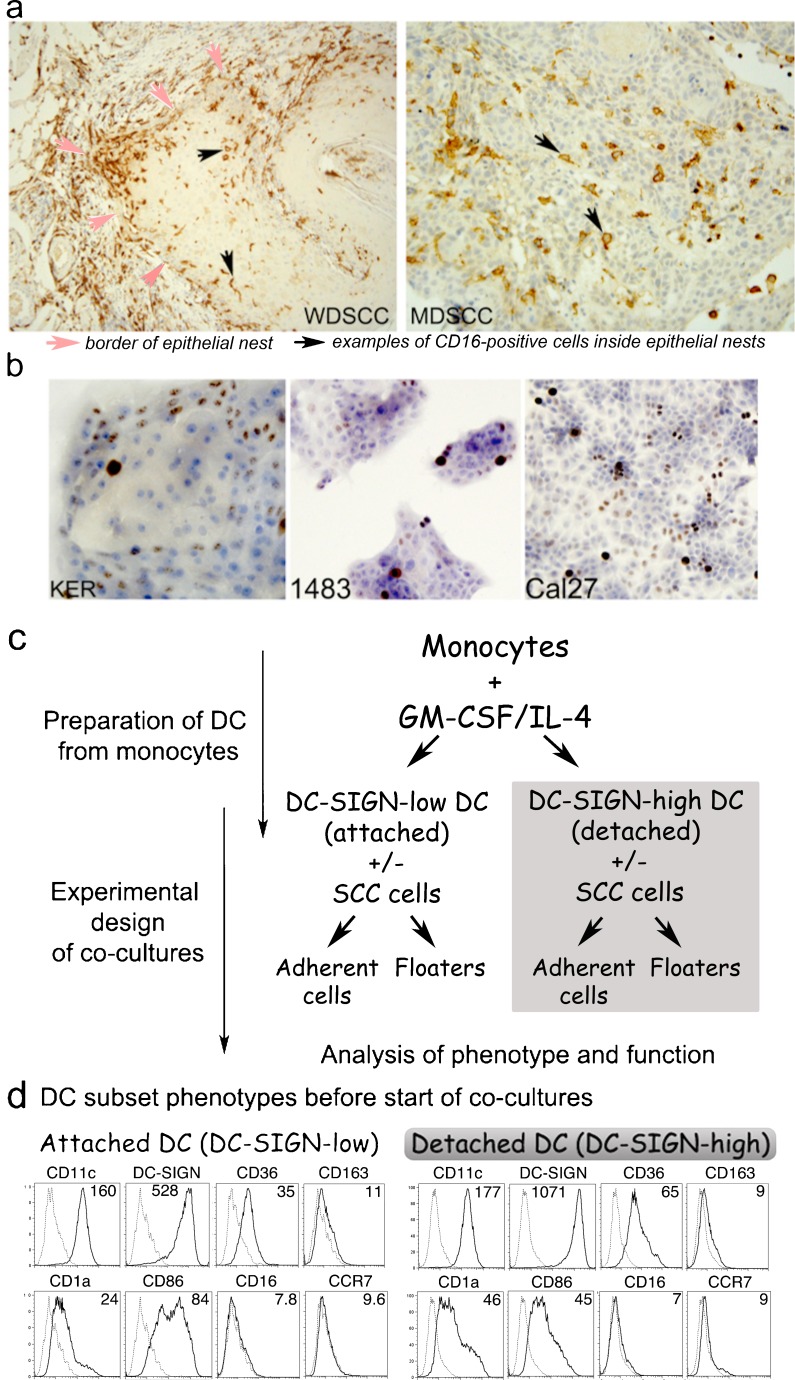
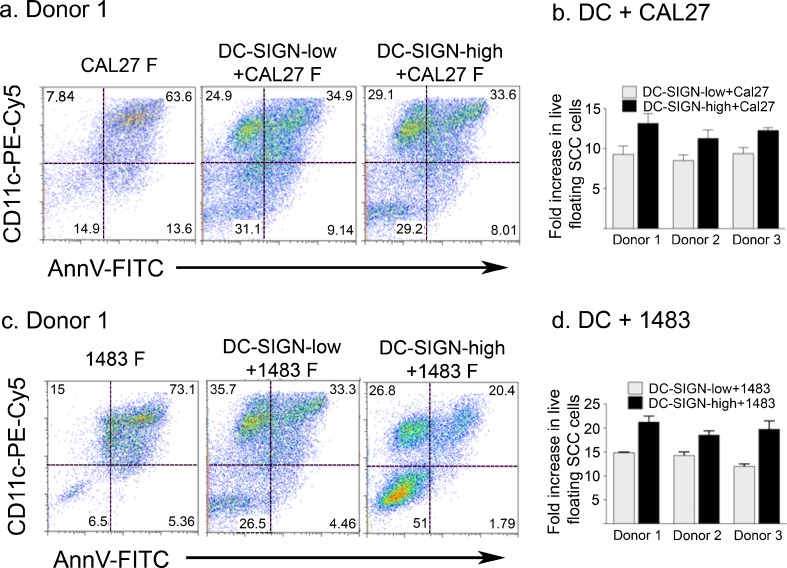
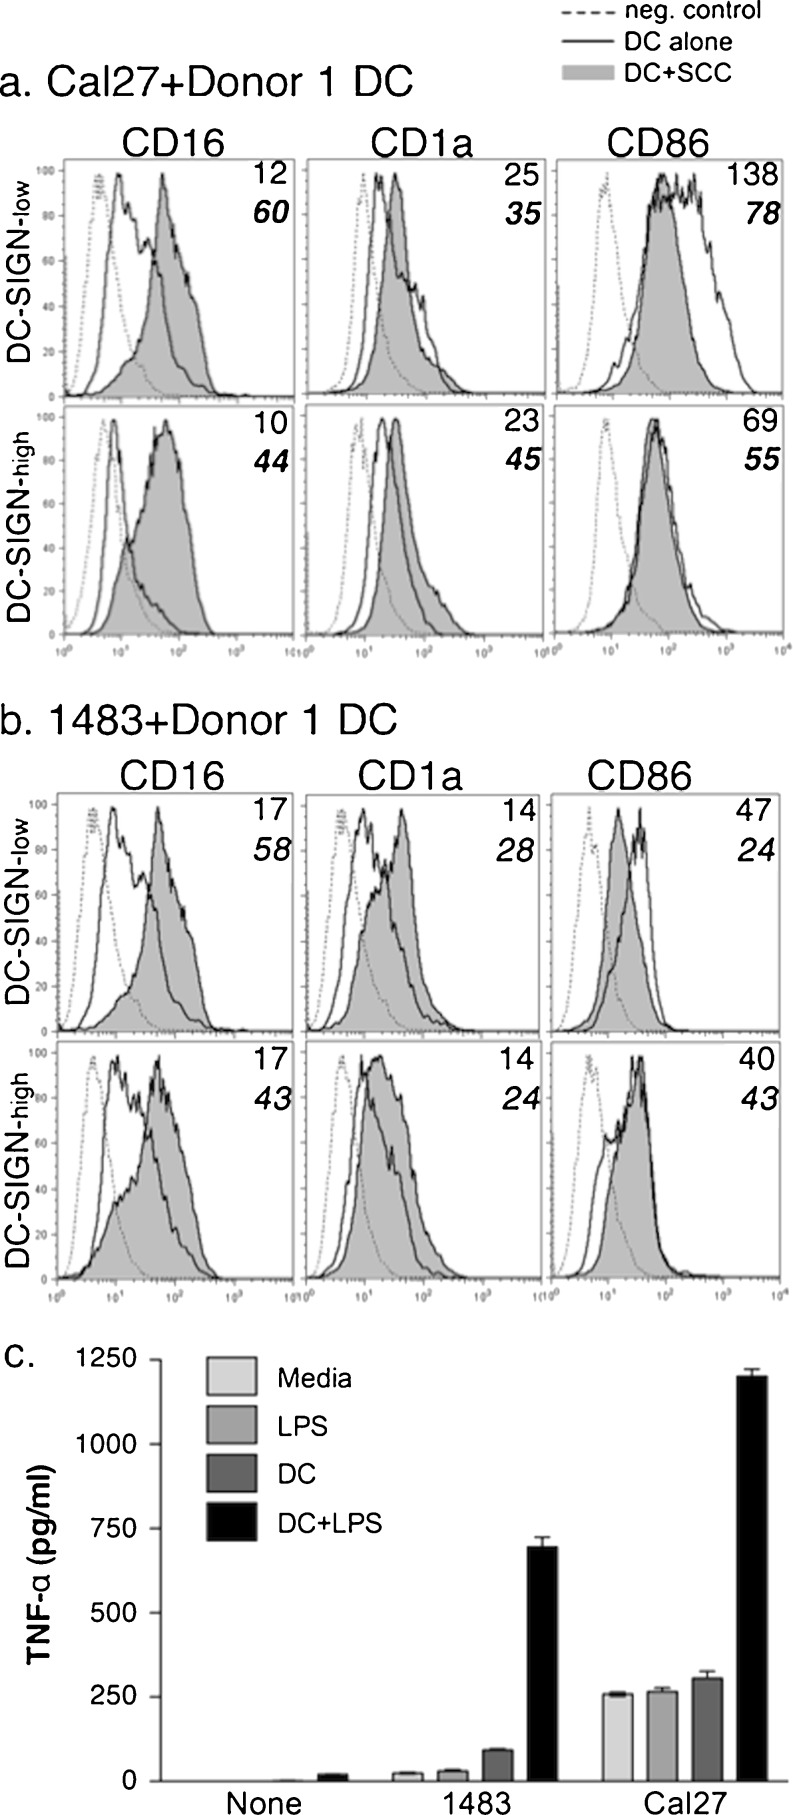
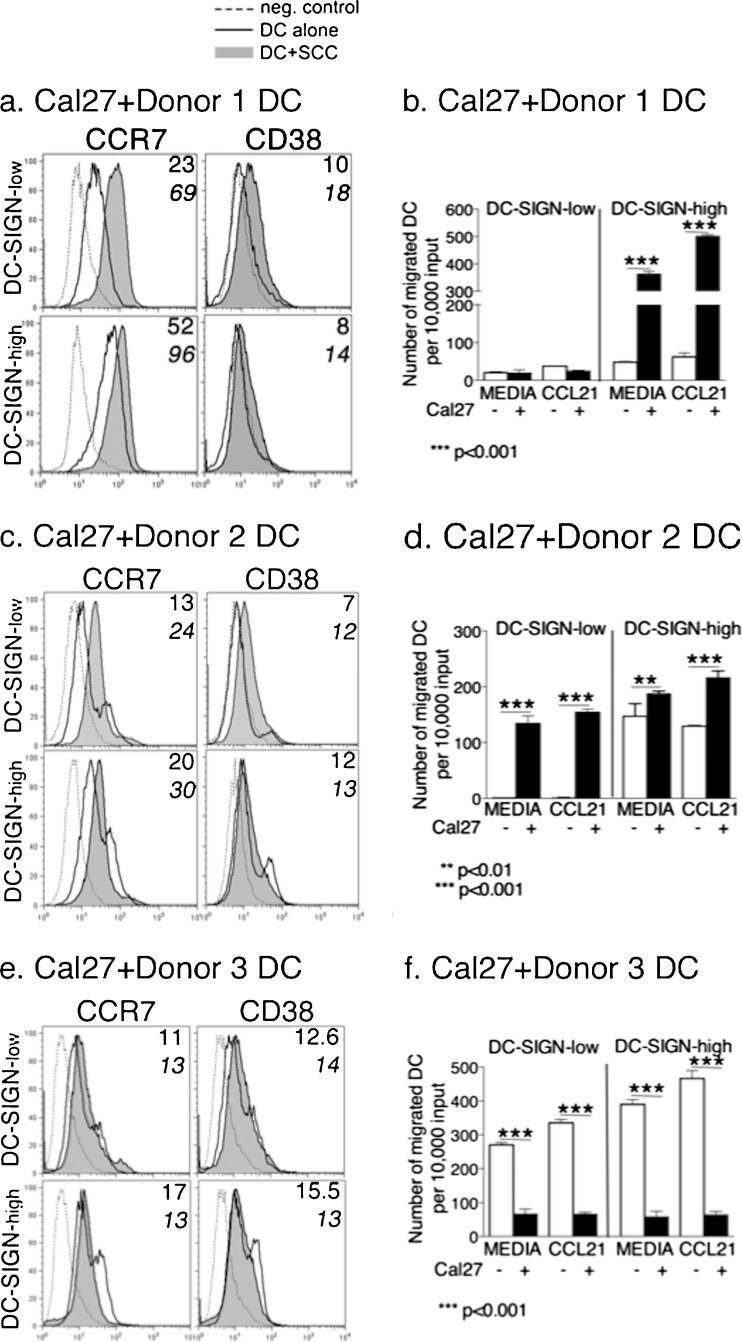
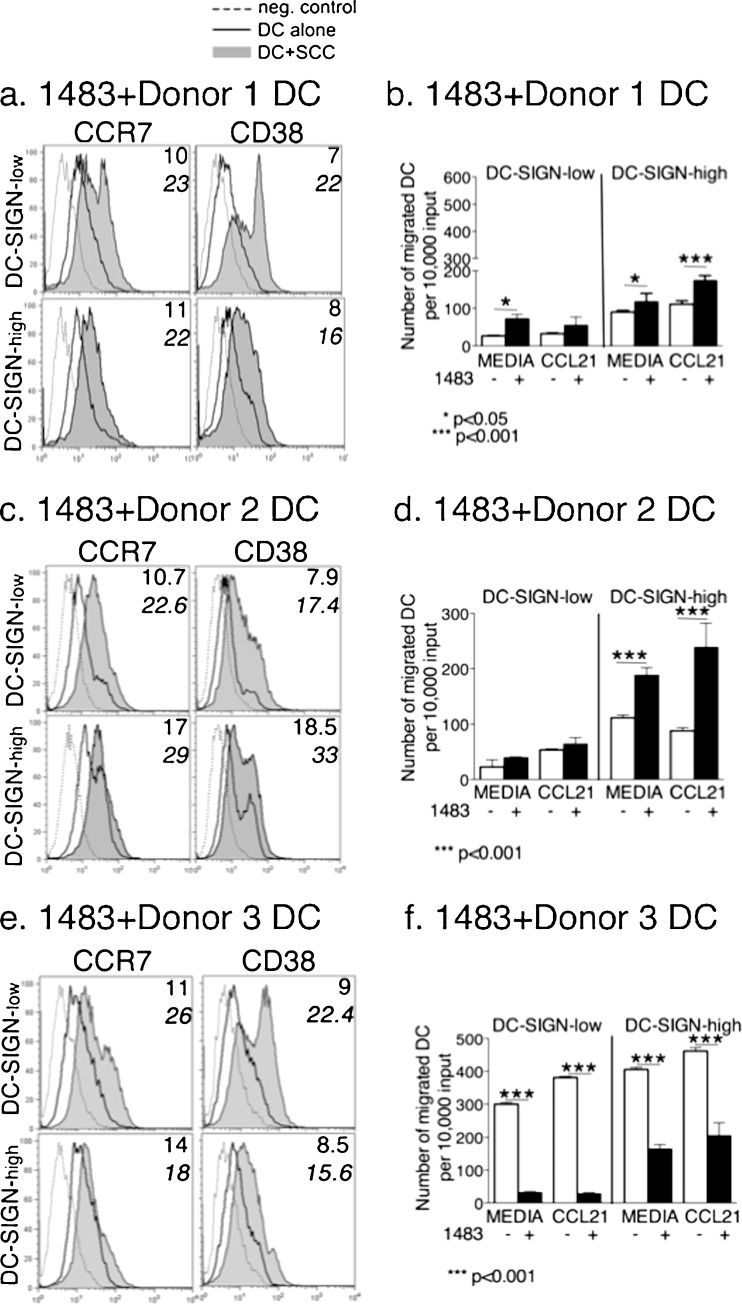
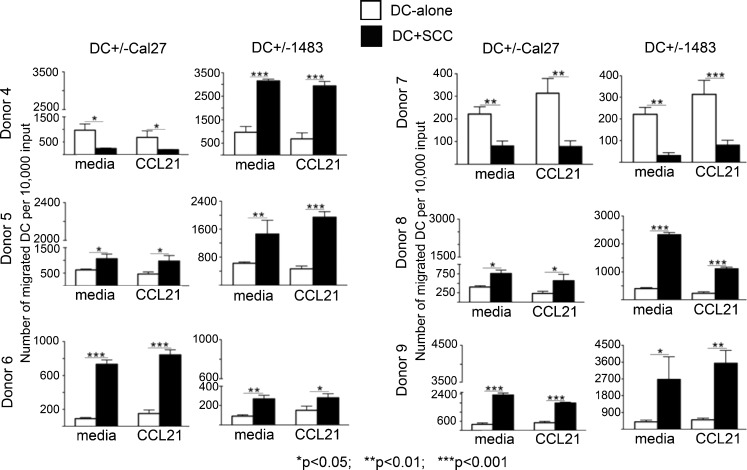
In the inflammatory mucosal microenvironment of head and neck SCC (HNSCC), DC express CD16 and are usually in direct contact with tumor cells. Mucosal and inflammation-associated DC develop from monocytes, and monocyte-derived DC are used in HNSCC immunotherapy. However, beyond apoptotic tumor cell uptake and presentation of tumor antigens by DC, HNSCC cell interactions with DC are poorly understood. Using co-cultures of monocyte-derived DC and two established HNSCC cell lines that represent well- and poorly-differentiated SCC, respectively, we found that carcinoma cells induced significant increases in CD16 expression on DC while promoting a CD1a(+)CD86(dim) immature phenotype, similar to that observed in HNSCC specimens. Moreover, HNSCC cells affected steady-state and CCL21-induced migration of DC, and these effects were donor-dependent. The CCL21-induced migration directly correlated with HNSCC-mediated effects on CCR7 and CD38 expression on DC-SIGN-high DC. The dominant pattern seen in six out of nine donors was the increase in steady-state and CCL21-induced DC migration in co-cultures with HNSCC, while the reverse pattern, i.e., decreased DC migration in co-cultures with SCC, was identified in two donors. A split in migratory DC behavior, i.e. increase with one HNSCC cell line and a decrease with the second cell line, was observed in one donor. Remarkably, the numbers of live detached HNSCC cells were orders of magnitude higher in DC-HNSCC co-cultures than in parallel HNSCC cell cultures without DC. This study provides novel insights into the effects of DC-HNSCC interactions relevant to the tumor microenvironment.
Figures
Similar articles
-
NET-producing CD16high CD62Ldim neutrophils migrate to tumor sites and predict improved survival in patients with HNSCC.Int J Cancer. 2017 Jun 1;140(11):2557-2567. doi: 10.1002/ijc.30671. Epub 2017 Mar 11. Int J Cancer. 2017. PMID: 28247912
-
Maturation of dendritic cells in the presence of living, apoptotic and necrotic tumour cells derived from squamous cell carcinoma of head and neck.Oral Oncol. 2005 Jan;41(1):17-24. doi: 10.1016/j.oraloncology.2004.05.006. Oral Oncol. 2005. PMID: 15598581
-
PDGF-AA mediates mesenchymal stromal cell chemotaxis to the head and neck squamous cell carcinoma tumor microenvironment.J Transl Med. 2016 Dec 8;14(1):337. doi: 10.1186/s12967-016-1091-6. J Transl Med. 2016. PMID: 27931212 Free PMC article.
-
Cyclic nucleotides promote monocyte differentiation toward a DC-SIGN+ (CD209) intermediate cell and impair differentiation into dendritic cells.J Immunol. 2003 Dec 15;171(12):6421-30. doi: 10.4049/jimmunol.171.12.6421. J Immunol. 2003. PMID: 14662841
-
[Effects of ovarian carcinoma cells on the maturation and function of human dendritic cells].Zhonghua Yi Xue Za Zhi. 2009 Mar 10;89(9):630-4. Zhonghua Yi Xue Za Zhi. 2009. PMID: 19595165 Chinese.
Cited by
-
Distinct patterns of intratumoral immune cell infiltrates in patients with HPV-associated compared to non-virally induced head and neck squamous cell carcinoma.Oncoimmunology. 2015 Jan 30;4(1):e965570. doi: 10.4161/21624011.2014.965570. eCollection 2015 Jan. Oncoimmunology. 2015. PMID: 25949860 Free PMC article.
-
Dendritic Cell Plasticity in Tumor-Conditioned Skin: CD14(+) Cells at the Cross-Roads of Immune Activation and Suppression.Front Immunol. 2013 Nov 25;4:403. doi: 10.3389/fimmu.2013.00403. Front Immunol. 2013. PMID: 24324467 Free PMC article. Review.
-
Functional characterization of a STAT3-dependent dendritic cell-derived CD14+ cell population arising upon IL-10-driven maturation.Oncoimmunology. 2013 Apr 1;2(4):e23837. doi: 10.4161/onci.23837. Oncoimmunology. 2013. PMID: 23734330 Free PMC article.
-
Dendritic cell-based immunotherapy for head and neck squamous cell carcinoma: advances and challenges.Front Immunol. 2025 May 26;16:1573635. doi: 10.3389/fimmu.2025.1573635. eCollection 2025. Front Immunol. 2025. PMID: 40491907 Free PMC article. Review.
-
Tumor stroma-derived factors skew monocyte to dendritic cell differentiation toward a suppressive CD14+ PD-L1+ phenotype in prostate cancer.Oncoimmunology. 2014 Dec 13;3(9):e955331. doi: 10.4161/21624011.2014.955331. eCollection 2014 Oct. Oncoimmunology. 2014. PMID: 25941611 Free PMC article.
References
LinkOut - more resources
Full Text Sources
Research Materials
