

Two myristoylated alanine-rich C-kinase substrate (MARCKS) paralogs are required for normal development in zebrafish
- PMID: 21809467
- PMCID: PMC4103011
- DOI: 10.1002/ar.21453
Two myristoylated alanine-rich C-kinase substrate (MARCKS) paralogs are required for normal development in zebrafish
Abstract
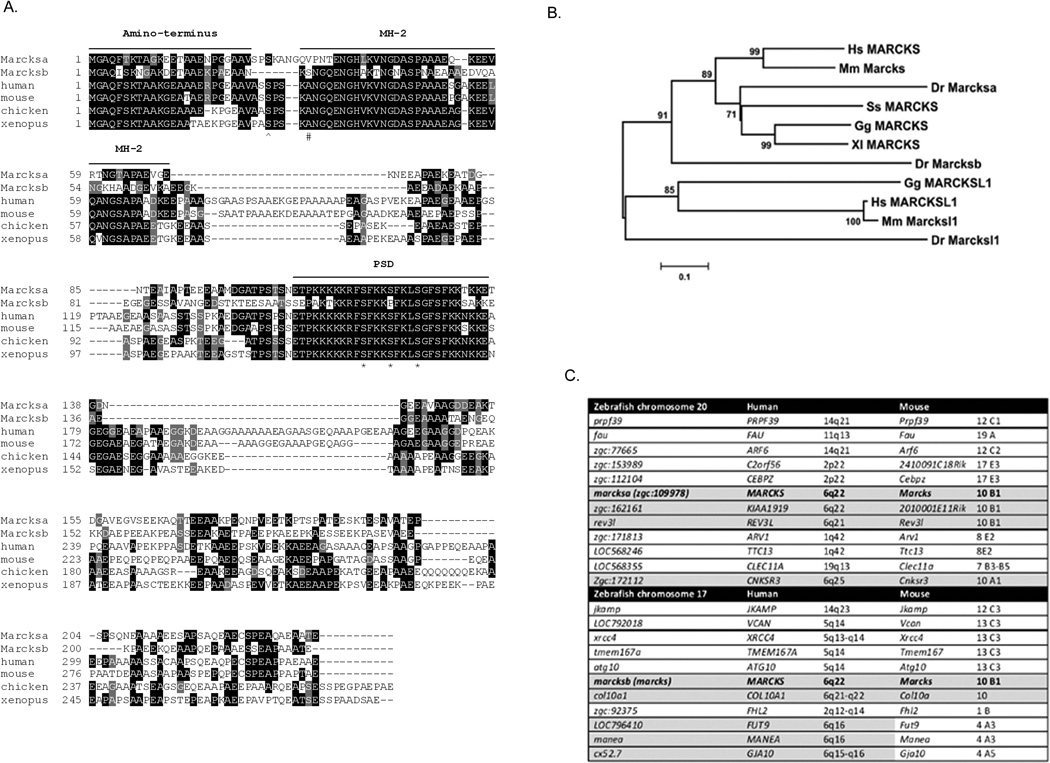
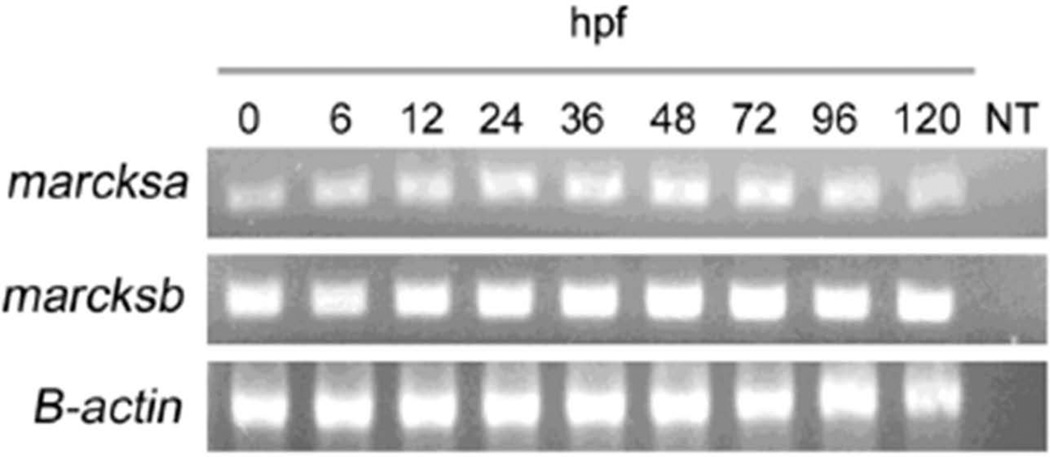
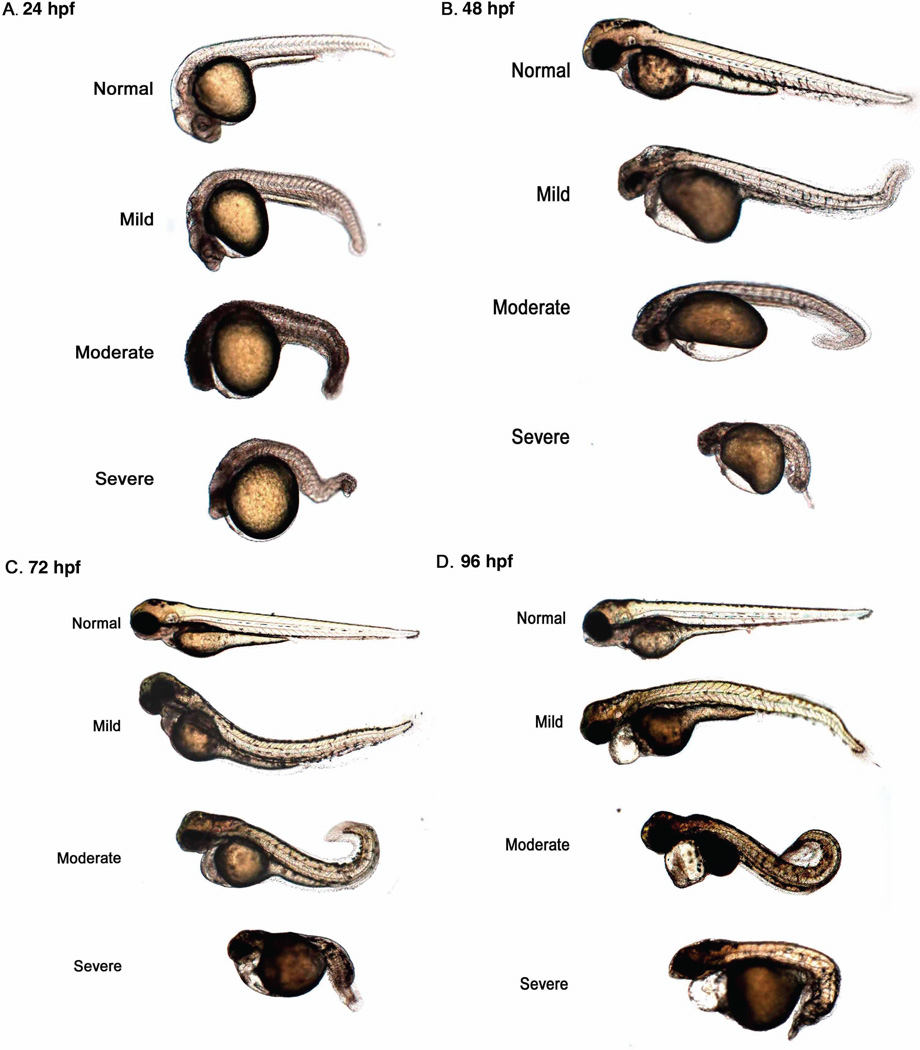
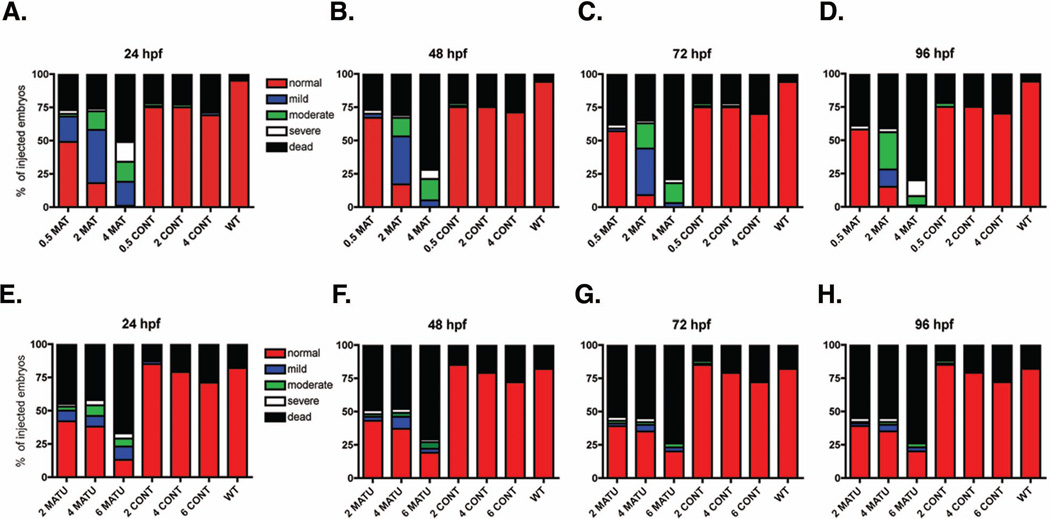
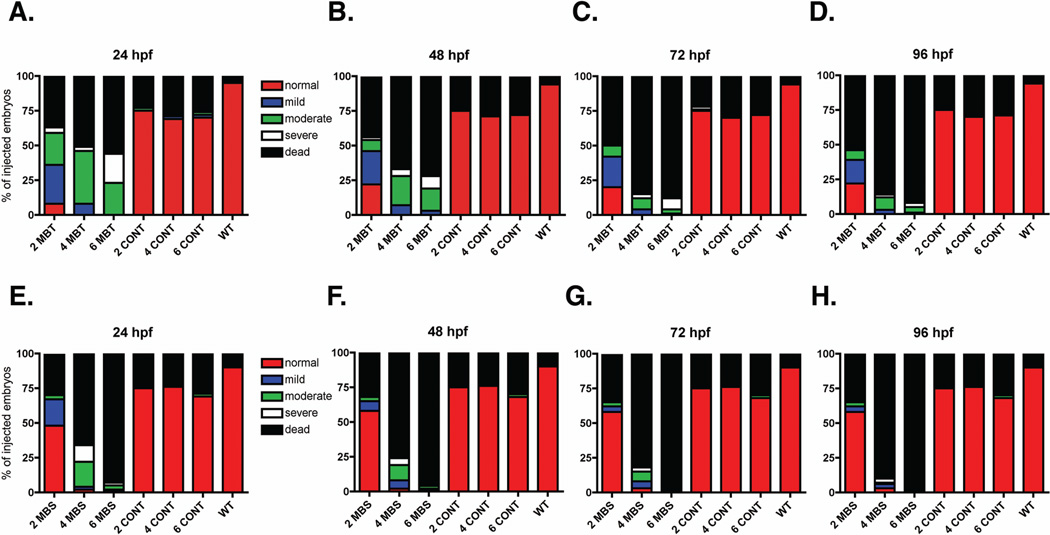
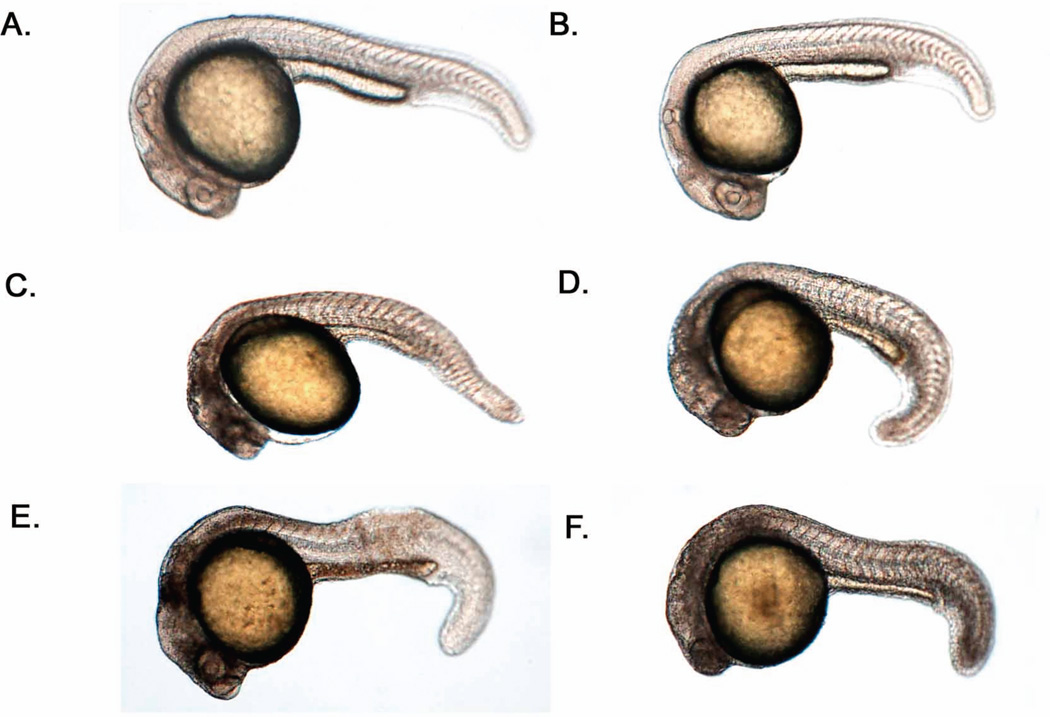
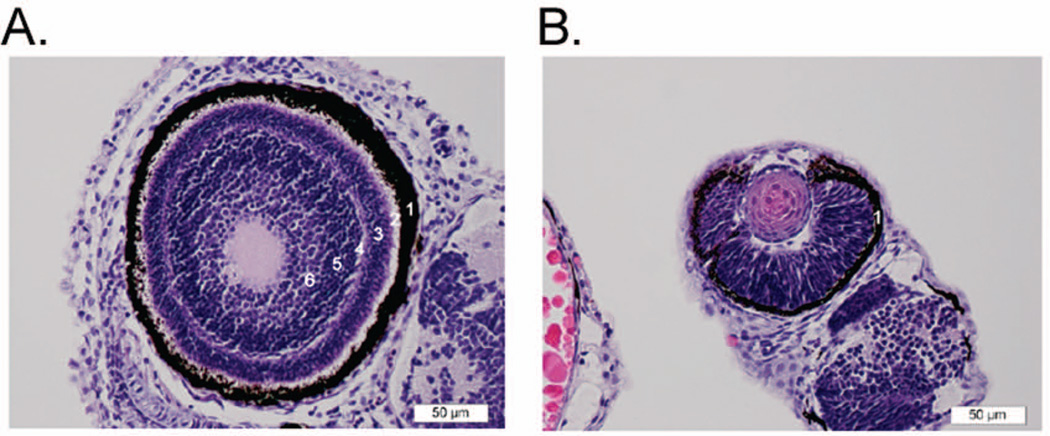
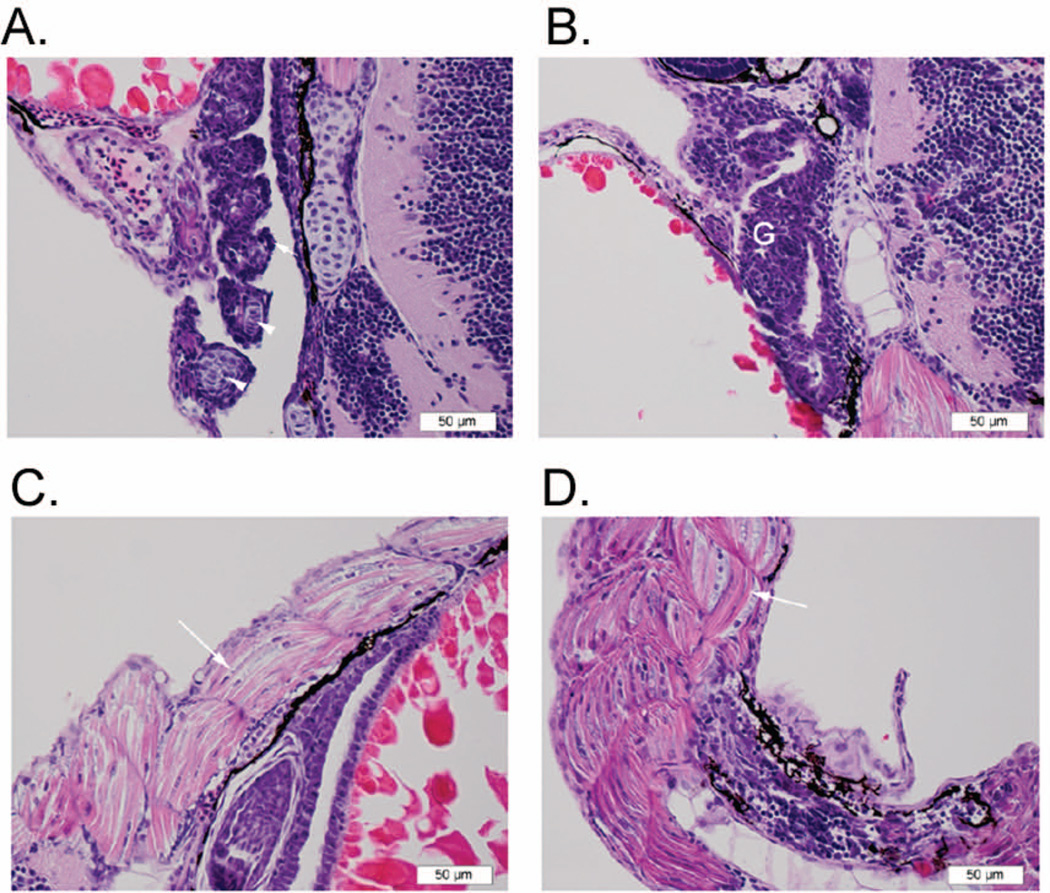
Myristoylated alanine-rich C-kinase substrate (MARCKS) is an actin binding protein substrate of protein kinase C (PKC) and critical for mouse and Xenopus development. Herein two MARCKS paralogs, marcksa and marcksb, are identified in zebrafish and the role of these genes in zebrafish development is evaluated. Morpholino-based targeting of either MARCKS protein resulted in increased mortality and a range of gross phenotypic abnormalities. Phenotypic abnormalities were classified as mild, moderate or severe, which is characterized by a slight curve of a full-length tail, a severe curve or twist of a full-length tail and a truncated tail, respectively. All three phenotypes displayed abnormal neural architecture. Histopathology of Marcks targeted embryos revealed abnormalities in retinal layering, gill formation and skeletal muscle morphology. These results demonstrate that Marcksa and Marcksb are required for normal zebrafish development and suggest that zebrafish are a suitable model to further study MARCKS function.
Keywords: MARCKS; development; zebrafish.
Copyright © 2011 Wiley-Liss, Inc.
Figures
Similar articles
-
Functional Diversification of the Four MARCKS Family Members in Zebrafish Neural Development.J Exp Zool B Mol Dev Evol. 2017 Jan;328(1-2):119-138. doi: 10.1002/jez.b.22691. Epub 2016 Aug 24. J Exp Zool B Mol Dev Evol. 2017. PMID: 27554589
-
Subtractive phage display technology identifies zebrafish marcksb that is required for gastrulation.Gene. 2013 May 25;521(1):69-77. doi: 10.1016/j.gene.2013.03.028. Epub 2013 Mar 26. Gene. 2013. PMID: 23537994
-
Myristoylated Alanine Rich C Kinase Substrate (MARCKS) is essential to β2-integrin dependent responses of equine neutrophils.Vet Immunol Immunopathol. 2014 Aug 15;160(3-4):167-76. doi: 10.1016/j.vetimm.2014.04.009. Epub 2014 May 2. Vet Immunol Immunopathol. 2014. PMID: 24857637 Free PMC article.
-
Calmodulin and protein kinase C cross-talk: the MARCKS protein is an actin filament and plasma membrane cross-linking protein regulated by protein kinase C phosphorylation and by calmodulin.Ciba Found Symp. 1992;164:145-54; discussion 154-61. doi: 10.1002/9780470514207.ch10. Ciba Found Symp. 1992. PMID: 1395931 Review.
-
Patent landscape highlighting therapeutic implications of peptides targeting myristoylated alanine-rich protein kinase-C substrate (MARCKS).Expert Opin Ther Pat. 2023 Jan-Jun;33(6):445-454. doi: 10.1080/13543776.2023.2240020. Epub 2023 Aug 1. Expert Opin Ther Pat. 2023. PMID: 37526024 Review.
Cited by
-
Unravelling paralogous gene expression dynamics during three-spined stickleback embryogenesis.Sci Rep. 2019 Mar 6;9(1):3752. doi: 10.1038/s41598-019-40127-2. Sci Rep. 2019. PMID: 30842559 Free PMC article.
-
MARCKS and MARCKS-like proteins in development and regeneration.J Biomed Sci. 2018 May 22;25(1):43. doi: 10.1186/s12929-018-0445-1. J Biomed Sci. 2018. PMID: 29788979 Free PMC article. Review.
-
A myristoylated alanine-rich C-kinase substrate (MARCKS) inhibitor peptide attenuates neutrophil outside-in β2-integrin activation and signaling.Cell Adh Migr. 2023 Dec;17(1):1-16. doi: 10.1080/19336918.2023.2233204. Cell Adh Migr. 2023. PMID: 37439125 Free PMC article.
-
Pathophysiological roles of myristoylated alanine-rich C-kinase substrate (MARCKS) in hematological malignancies.Biomark Res. 2021 May 6;9(1):34. doi: 10.1186/s40364-021-00286-9. Biomark Res. 2021. PMID: 33958003 Free PMC article. Review.
-
Marcksb plays a key role in the secretory pathway of zebrafish Bmp2b.PLoS Genet. 2019 Sep 23;15(9):e1008306. doi: 10.1371/journal.pgen.1008306. eCollection 2019 Sep. PLoS Genet. 2019. PMID: 31545789 Free PMC article.
References
-
- Aderem A. The MARCKS brothers: A family of protein kinase C substrates. Cell. 1992;71:713–716. - PubMed
-
- Ali N, Macala LJ, Hayslett JP. Identification and characterization of MARCKS in xenopus laevis. Biochem Biophys Res Commun. 1997;234:143–146. - PubMed
-
- Blackshear PJ. The MARCKS family of cellular protein kinase C substrates. J Biol Chem. 1993;268:1501–1504. - PubMed
MeSH terms
Substances
Associated data
- Actions
- Actions
Grants and funding
LinkOut - more resources
Full Text Sources
Molecular Biology Databases
Miscellaneous
