

CSAR benchmark exercise of 2010: combined evaluation across all submitted scoring functions
- PMID: 21809884
- PMCID: PMC3186041
- DOI: 10.1021/ci200269q
CSAR benchmark exercise of 2010: combined evaluation across all submitted scoring functions
Abstract
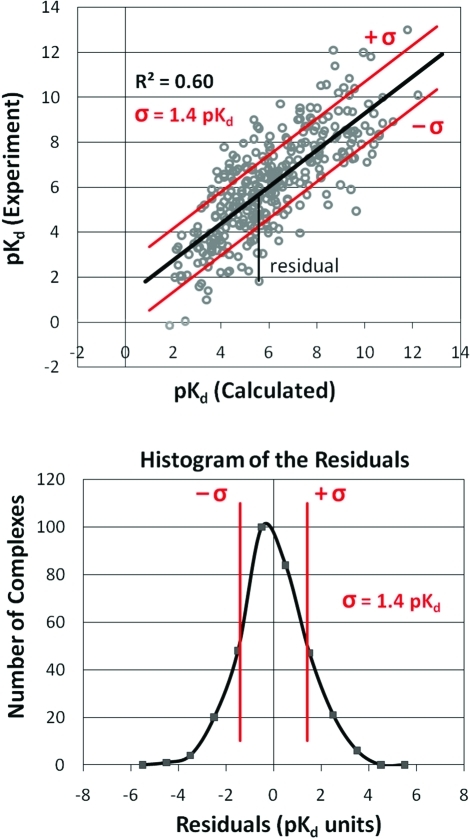
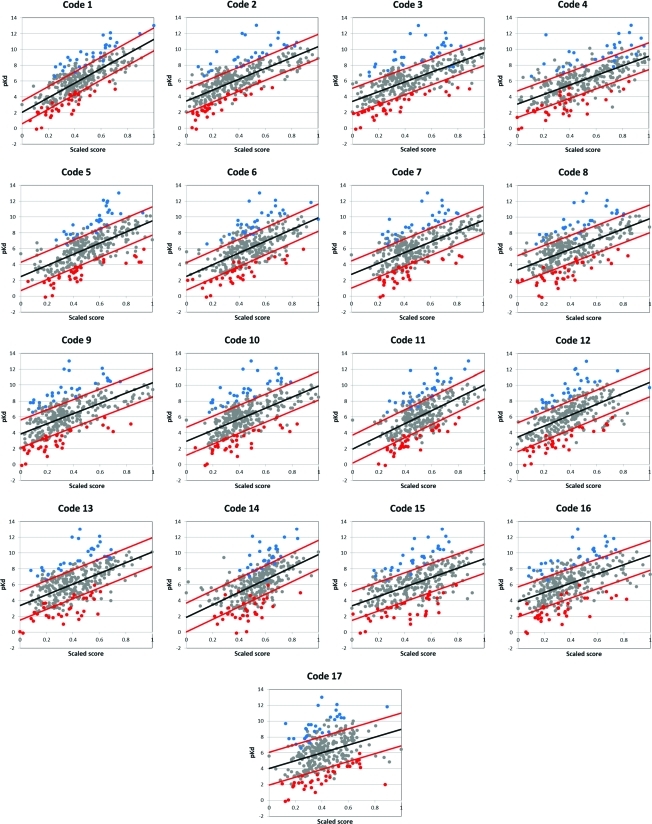
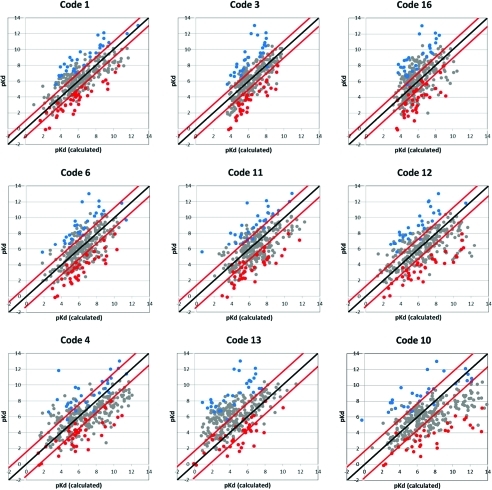
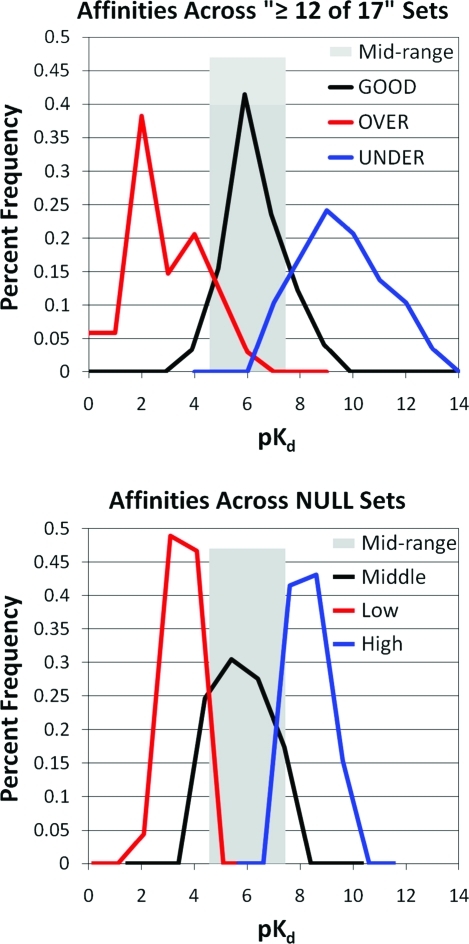
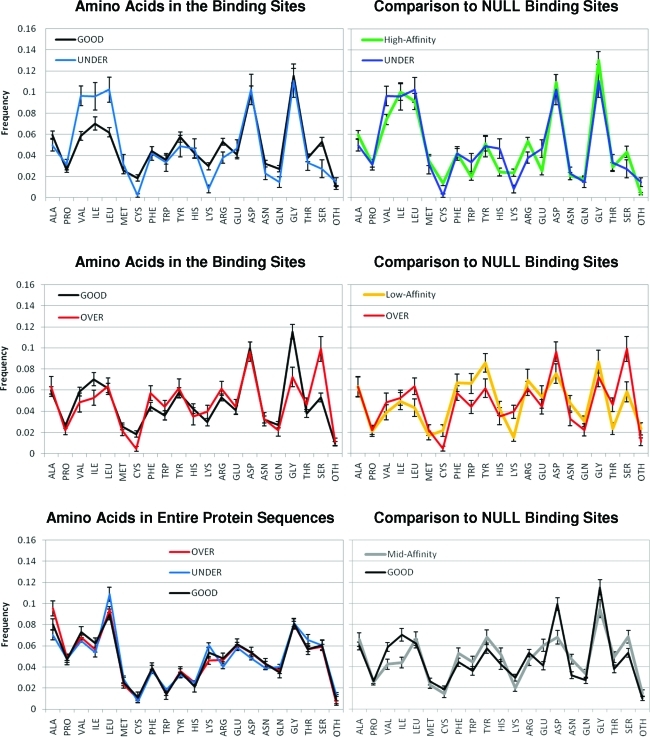
As part of the Community Structure-Activity Resource (CSAR) center, a set of 343 high-quality, protein-ligand crystal structures were assembled with experimentally determined K(d) or K(i) information from the literature. We encouraged the community to score the crystallographic poses of the complexes by any method of their choice. The goal of the exercise was to (1) evaluate the current ability of the field to predict activity from structure and (2) investigate the properties of the complexes and methods that appear to hinder scoring. A total of 19 different methods were submitted with numerous parameter variations for a total of 64 sets of scores from 16 participating groups. Linear regression and nonparametric tests were used to correlate scores to the experimental values. Correlation to experiment for the various methods ranged R(2) = 0.58-0.12, Spearman ρ = 0.74-0.37, Kendall τ = 0.55-0.25, and median unsigned error = 1.00-1.68 pK(d) units. All types of scoring functions-force field based, knowledge based, and empirical-had examples with high and low correlation, showing no bias/advantage for any particular approach. The data across all the participants were combined to identify 63 complexes that were poorly scored across the majority of the scoring methods and 123 complexes that were scored well across the majority. The two sets were compared using a Wilcoxon rank-sum test to assess any significant difference in the distributions of >400 physicochemical properties of the ligands and the proteins. Poorly scored complexes were found to have ligands that were the same size as those in well-scored complexes, but hydrogen bonding and torsional strain were significantly different. These comparisons point to a need for CSAR to develop data sets of congeneric series with a range of hydrogen-bonding and hydrophobic characteristics and a range of rotatable bonds.
Figures
References
-
- Leach A. R.; Shoichet B. K.; Peishoff C. E. Prediction of protein-ligand interactions. Docking and scoring: successes and gaps. J. Med. Chem. 2006, 49, 5851–5855. - PubMed
-
- Warren G. L.; Andrews C. W.; Capelli A.-M.; Clarke B.; LaLonde J.; Lambert M. H.; Lindvall M.; Nevins N.; Semus S. F.; Senger S.; Tedesco G.; Wall I. D.; Woolven J. M.; Peishoff C. E.; Head M. S. A critical assessment of docking programs and scoring functions. J. Med. Chem. 2006, 49, 5912–5931. - PubMed
-
- Wang R.; Lu Y.; Wang S. Comparative evaluation of 11 scoring functions for molecular docking. J. Med. Chem. 2003, 46, 2287–2303. - PubMed
-
- Muchmore S. W.; Debe D. A.; Metz J. T.; Brown S. P.; Martin Y. C.; Hajduk P. J. Application of belief theory to similarity data fusion for use in analog searching and lead hopping. J. Chem. Inf. Model. 2008, 48, 941–948. - PubMed
Publication types
MeSH terms
Substances
Grants and funding
LinkOut - more resources
Full Text Sources
Research Materials
