. 2012 Jan 2;59(1):431-8.
doi: 10.1016/j.neuroimage.2011.07.044. Epub 2011 Jul 23.

The influence of head motion on intrinsic functional connectivity MRI

Affiliations

The influence of head motion on intrinsic functional connectivity MRI

Koene R A Van Dijk et al. Neuroimage. .

Abstract

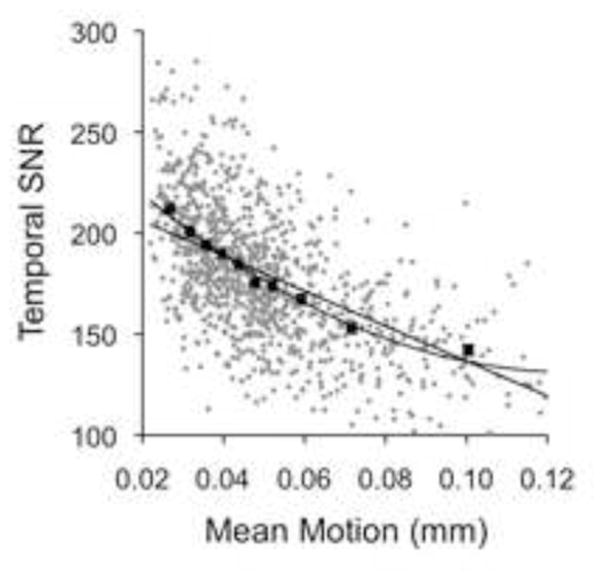
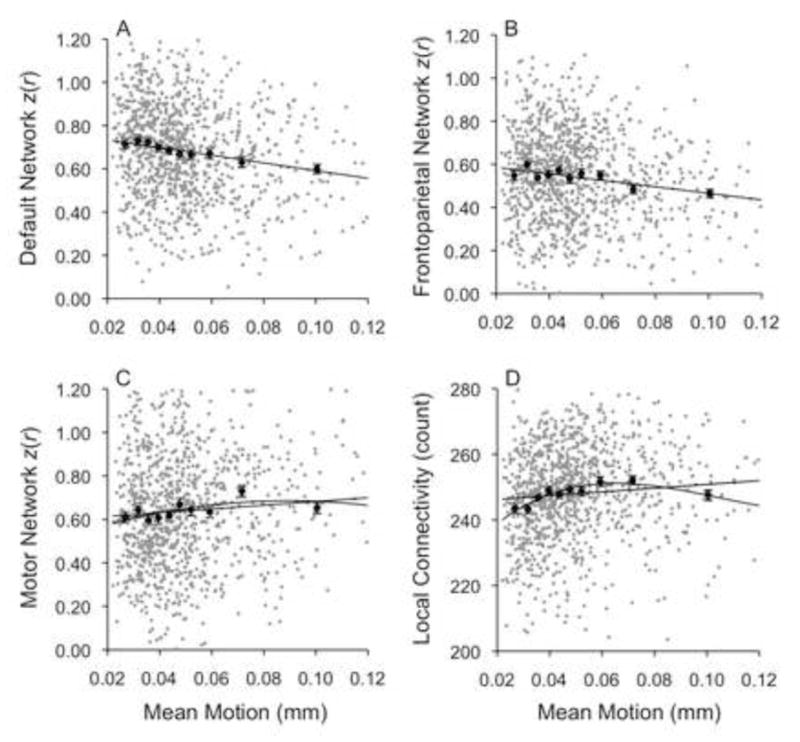
Functional connectivity MRI (fcMRI) has been widely applied to explore group and individual differences. A confounding factor is head motion. Children move more than adults, older adults more than younger adults, and patients more than controls. Head motion varies considerably among individuals within the same population. Here we explored the influence of head motion on fcMRI estimates. Mean head displacement, maximum head displacement, the number of micro movements (>0.1 mm), and head rotation were estimated in 1000 healthy, young adult subjects each scanned for two resting-state runs on matched 3T scanners. The majority of fcMRI variation across subjects was not linked to head motion. However, head motion had significant, systematic effects on fcMRI network measures. Head motion was associated with decreased functional coupling in the default and frontoparietal control networks--two networks characterized by coupling among distributed regions of association cortex. Other network measures increased with motion including estimates of local functional coupling and coupling between left and right motor regions--a region pair sometimes used as a control in studies to establish specificity. Comparisons between groups of individuals with subtly different levels of head motion yielded difference maps that could be mistaken for neuronal effects in other contexts. These effects are important to consider when interpreting variation between groups and across individuals.


Figures

Figure 1
Figure 1
Head motion estimates across subjects. (A) The frequency distribution of Mean Motion across the full sample (n = 1088). Mean Motion represents the mean absolute displacement of each brain volume as compared to the previous volume. Black bars represent females; white bars represent males. The distribution of motion for female subjects is shifted lower in relation to the male subjects. (B) The relation between Mean Motion and the Maximum Motion is illustrated. Each point represents a unique subject. The line plots linear regression (r = 0.67, p < 0.001). (C) The relation between Mean Motion and the Number of Movements between adjacent volumes > 0.1 mm (r = 0.96, p < 0.001). (D) The relation between Mean Motion and Rotation angle (r = 0.84, p < 0.001).
Figure 2
Figure 2
Head motion is associated with reduced temporal signal-to-noise ratio (tSNR). The grey circles each represent a unique subject from a random sampling of 1000 subjects. There is a clear (expected) relation between Mean Motion and tSNR. The black line and curve represent the best linear (r = −0.57, p < 0.001) and non-linear fit (r = −0.61, p < 0.001) to the full sample of subjects. The black circles represent the mean values for each of 10 subgroups of subjects that were divided based on Mean Motion. Each black circle is from 100 (10%) of the sample, so the leftmost circle is from the stillest 10% of the sample and the rightmost circle is from the 10% of the sample with the greatest head motion. Bars around the circles represent standard errors of the mean. The last two subgroups (20% of the sample) moved considerably more than the other eight subgroups, consistent with the skewed distribution apparent in Figure 1.
Figure 3
Figure 3
Head motion is significantly correlated with functional connectivity but in opposing directions for distinct measures. Plot format parallels Figure 2. (A) Functional correlation among regions within the default network shows a significant linear (r = −0.18, p < 0.001) decrease with increasing Mean Motion. (B) Functional correlation among regions in the frontoparietal network also shows a significant linear decrease with increasing Mean Motion (r = −0.16, p < 0.001). Non-linear regressions were not different from the linear fit. (C) Functional correlation between left and right motor regions shows a significant linear (r = 0.07, p = 0.026) and non-linear (r = 0.11, p = 0.003) increase with increasing Mean Motion. (D) Local functional coupling, a measure of functional connectivity to nearby voxels, also shows a significant linear (r = 0.09, p = 0.005) and non-linear (r = 0.15, p < 0.001) increase with increasing Mean Motion. The most extreme movers appear to show a decrease. The possibility of non-linear effects of head motion will be important to analysis strategies.
Figure 4
Figure 4
Maps reveal functional connectivity network differences based solely on head motion. Group functional connectivity difference maps are presented to illustrate how head motion might confound an analysis. Each map represents the functional connectivity difference for one group of 100 subjects with lesser motion as compared to a second group with greater motion. Each map displays the surface projection for the difference for a seed region placed in the posterior cingulate. The leftmost image shows the contrast between the two most extreme groups (Group 1 is the stillest 10% of subjects and Group 10 is the liveliest 10% of the subjects). Functional connectivity differences are observed throughout the default network including medial prefrontal cortex, lateral temporal cortex, and the inferior parietal lobule. The middle image shows a more moderate contrast between Groups 3 and 8. The rightmost image shows the contrast between Groups 5 and 6 that have Mean Motion estimates of 0.044 and 0.048 mm – an extremely subtle difference. Even in this tight range of motion, differences in head motion yield difference maps that could easily be mistaken for neuronal effects.
Figure 5
Figure 5
Between-subject differences in head motion are stable. Mean Motion estimates are plotted for two separate scanning sessions conducted on separate days. Each data point represents a unique person. The correlation is significant (r = 0.57, p < 0.001) and increases further if the four outliers (denoted by diamonds) are removed (r = 0.66). Analyses of functional connectivity will need to consider the possibility that certain aspects of head motion behave as a trait and present a potential confound when exploring individual differences.

Similar articles

Cited by

References

    1. Andrews-Hanna JR, Snyder AZ, Vincent JL, Lustig C, Head D, Raichle ME, Buckner RL. Disruption of large-scale brain systems in advanced aging. Neuron. 2007;56:924–935. - PMC - PubMed
    1. Beall EB, Lowe MJ. Isolating physiologic noise sources with independently determined spatial measures. Neuroimage. 2007;37:1286–1300. - PubMed
    1. Beall EB, Lowe MJ. The non-separability of physiologic noise in functional connectivity MRI with spatial ICA at 3T. J Neurosci Methods. 2010;191:263–276. - PubMed
    1. Birn RM, Murphy K, Bandettini PA. The effect of respiration variations on independent component analysis results of resting state functional connectivity. Hum Brain Mapp. 2008a;29:740–750. - PMC - PubMed
    1. Birn RM, Smith MA, Jones TB, Bandettini PA. The respiration response function: the temporal dynamics of fMRI signal fluctuations related to changes in respiration. Neuroimage. 2008b;40:644–654. - PMC - PubMed

Publication types