. 2011 Oct;49(4):799-809.
doi: 10.1016/j.bone.2011.07.018. Epub 2011 Jul 23.

Variation in childhood skeletal robustness is an important determinant of cortical area in young adults

Affiliations

Variation in childhood skeletal robustness is an important determinant of cortical area in young adults

Siddharth Bhola et al. Bone. 2011 Oct.

Abstract

A better understanding of bone growth will benefit efforts to reduce fracture incidence, because variation in elderly bone traits is determined primarily by adulthood. The natural variation in robustness was used as a model to understand how variable growth patterns define adult bone morphology. Longitudinally acquired hand radiographs of 29 boys and 30 girls were obtained from the Bolton-Brush study for 6 time points spanning 8 to 18 years of age. Segregating individuals into tertiles based on robustness revealed that the biological activity underlying bone growth varied significantly with the natural variation in robustness. For boys, slender metacarpals used an osteoblast-dependent growth pattern to establish function, whereas robust metacarpals used an osteoclast-dependent growth pattern. In contrast, differences in biological activity between girls with slender and robust metacarpals were largely based on the age at which the marrow surface changed from expansion to infilling. Importantly, cortical area for slender metacarpals was as much as 19.7% and 32.2% lower than robust metacarpals for boys and girls, respectively, indicating that robustness was a major determinant of adult cortical area. Finally, after accounting for robustness and body weight effects, we found that the inter-individual variation in cortical area was established as early as 8 years of age. While variation in the amount of bone acquired during growth has primarily been attributed to factors like nutrition, exercise, and genetic background, we showed that the natural variation in robustness was also a major determinant of cortical area, which is an important determinant of bone mass. This predictable relationship between robustness and cortical area should be incorporated into clinical diagnostic measures and experimental studies.


Conflict of interest statement

Conflict of Interest: All authors have no conflict of interest.

Figures

Figure 1
Figure 1
Age-changes in robustness (Tt.Ar/Le) of the a) second and b) third metacarpals for girls and of the c) second and d) third metacarpals for boys. Closed circles represent individual data points for each age and the lines indicate the regression for each boy and girl.
Figure 1
Figure 1
Age-changes in robustness (Tt.Ar/Le) of the a) second and b) third metacarpals for girls and of the c) second and d) third metacarpals for boys. Closed circles represent individual data points for each age and the lines indicate the regression for each boy and girl.
Figure 2
Figure 2
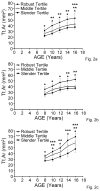
A comparison of changes in total cross-sectional area (Tt.Ar) during adolescence among robustness tertiles established at 10 years of age for the a) second metacarpal of girls; b) third metacarpal of girls; c) second metacarpal of boys, and d) third metacarpal of boys. The symbols represent the average trait values for each time point, and the error bars are the standard deviations. Differences among groups were compared at each age based on t-tests corrected for multiple comparisons (p<0.008). * indicates T1 versus T3; ** indicates T2 versus T3; *** indicates T1 versus T2.
Figure 2
Figure 2
A comparison of changes in total cross-sectional area (Tt.Ar) during adolescence among robustness tertiles established at 10 years of age for the a) second metacarpal of girls; b) third metacarpal of girls; c) second metacarpal of boys, and d) third metacarpal of boys. The symbols represent the average trait values for each time point, and the error bars are the standard deviations. Differences among groups were compared at each age based on t-tests corrected for multiple comparisons (p<0.008). * indicates T1 versus T3; ** indicates T2 versus T3; *** indicates T1 versus T2.
Figure 3
Figure 3
A comparison of changes in marrow area (Ma.Ar) during adolescence among robustness tertiles established at 10 years of age for the a) second metacarpal of girls; b) third metacarpal of girls; c) second metacarpal of boys, and d) third metacarpal of boys. The symbols represent the average trait values for each time point, and the error bars are the standard deviations. Differences among groups were compared at each age based on t-tests corrected for multiple comparisons (p<0.008). * indicates T1 versus T3; ** indicates T2 versus T3; *** indicates T1 versus T2.
Figure 3
Figure 3
A comparison of changes in marrow area (Ma.Ar) during adolescence among robustness tertiles established at 10 years of age for the a) second metacarpal of girls; b) third metacarpal of girls; c) second metacarpal of boys, and d) third metacarpal of boys. The symbols represent the average trait values for each time point, and the error bars are the standard deviations. Differences among groups were compared at each age based on t-tests corrected for multiple comparisons (p<0.008). * indicates T1 versus T3; ** indicates T2 versus T3; *** indicates T1 versus T2.
Figure 4
Figure 4
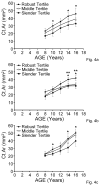
A comparison of changes in cortical area (Ct.Ar) during adolescence among robustness tertiles established at 10 years of age for the a) second metacarpal of girls; b) third metacarpal of girls; c) second metacarpal of boys, and d) third metacarpal of boys. The symbols represent the average trait values for each time point, and the error bars are the standard deviations. Differences among groups were compared at each age based on t-tests corrected for multiple comparisons (p<0.008). * indicates T1 versus T3; ** indicates T2 versus T3; *** indicates T1 versus T2.
Figure 4
Figure 4
A comparison of changes in cortical area (Ct.Ar) during adolescence among robustness tertiles established at 10 years of age for the a) second metacarpal of girls; b) third metacarpal of girls; c) second metacarpal of boys, and d) third metacarpal of boys. The symbols represent the average trait values for each time point, and the error bars are the standard deviations. Differences among groups were compared at each age based on t-tests corrected for multiple comparisons (p<0.008). * indicates T1 versus T3; ** indicates T2 versus T3; *** indicates T1 versus T2.
Figure 5
Figure 5
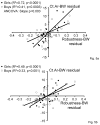
Accounting for body weight (BW) effects by partial regression analysis showed significant correlations between cortical area (Ct.Ar) and robustness at 16 years of age for the a) second and b) third metacarpals.
Figure 6
Figure 6
Schematic representation of growth patterns of the metacarpal diaphysis for a) boys and b) girls were developed based on the age-changes in Tt.Ar and Ma.Ar reported in Tables 2 and 3. Growth patterns were segregated relative to robustness tertiles to show differences in the biological activity underlying the development of bone function. Biological processes are indicated for the periosteal and endocortical surfaces by the line quality, where the solid line indicates apposition, the dashed line indicates resorption, and the dotted line indicates a balanced condition in which there is no net change in the bone surface movement over time.
Figure 6
Figure 6
Schematic representation of growth patterns of the metacarpal diaphysis for a) boys and b) girls were developed based on the age-changes in Tt.Ar and Ma.Ar reported in Tables 2 and 3. Growth patterns were segregated relative to robustness tertiles to show differences in the biological activity underlying the development of bone function. Biological processes are indicated for the periosteal and endocortical surfaces by the line quality, where the solid line indicates apposition, the dashed line indicates resorption, and the dotted line indicates a balanced condition in which there is no net change in the bone surface movement over time.

References

    1. Aeberli D, Eser P, Bonel H, Widmer J, Caliezi G, Varisco PA, Moller B, Villiger PM. Reduced trabecular bone mineral density and cortical thickness accompanied by increased outer bone circumference in metacarpal bone of rheumatoid arthritis patients: a cross-sectional study. Arthritis Res Ther. 2010;12:R119. - PMC - PubMed
    1. Albright F, Smith PH, Richardson AM. Post-menopausal osteoporosis. Its clinical features. JAMA. 1941;116:2465–2474.
    1. Barnett NBE. The clinical and radiological problem of thin bones. Br J Radiol. 1961;34:683–92. - PubMed
    1. Binkley TL, Berry R, Specker BL. Methods for measurement of pediatric bone. Rev Endocr Metab Disord. 2008;9:95–106. - PubMed
    1. Bradney M, Pearce G, Naughton G, Sullivan C, Bass S, Beck T, Carlson J, Seeman E. Moderate exercise during growth in prepubertal boys: changes in bone mass, size, volumetric density, and bone strength: a controlled prospective study. J Bone Miner Res. 1998;13:1814–21. - PubMed

Publication types

MeSH terms