Review
. 2012 Feb;50(2):525-33.
doi: 10.1016/j.bone.2011.07.002.

HDL cholesterol and bone mineral density: is there a genetic link?

Affiliations
Review

HDL cholesterol and bone mineral density: is there a genetic link?

Cheryl L Ackert-Bicknell. Bone. 2012 Feb.

Abstract

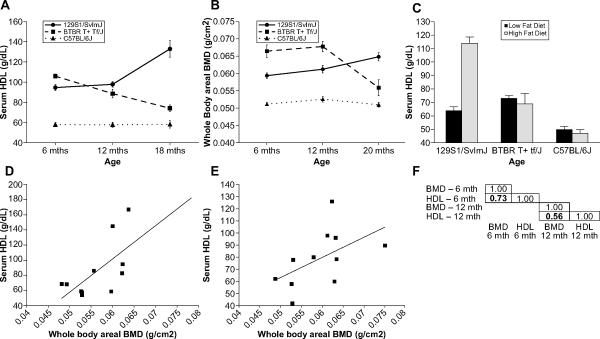
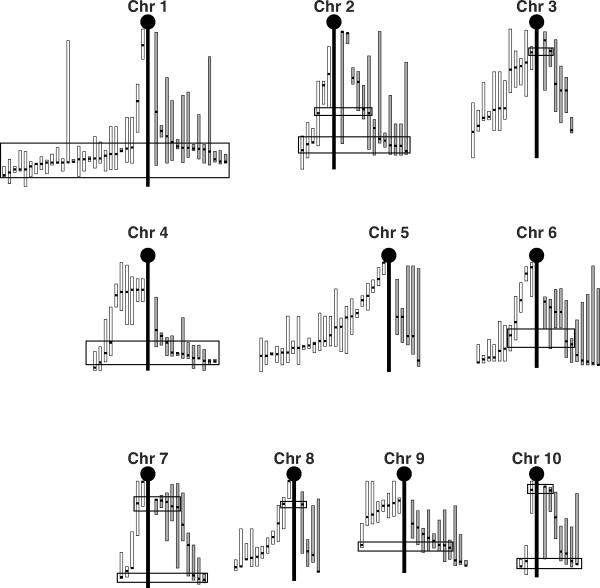
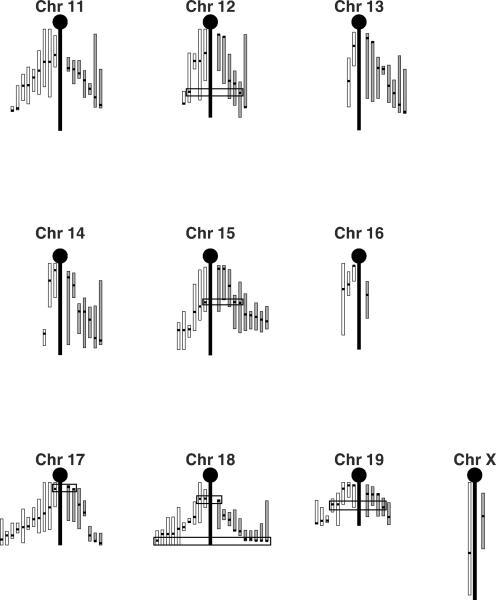
Overwhelming evidence has linked cardiovascular disease and osteoporosis, but the shared root cause of these two diseases of the elderly remains unknown. Low levels of high density lipoprotein cholesterol (HDL) and bone mineral density (BMD) are risk factors for cardiovascular disease and osteoporosis respectively. A number of correlation studies have attempted to determine if there is a relationship between serum HDL and BMD but these studies are confounded by a number of variables including age, diet, genetic background, gender and hormonal status. Collectively, these data suggest that there is a relationship between these two phenotypes, but that the nature of this relationship is context specific. Studies in mice plainly demonstrate that genetic loci for BMD and HDL co-map and transgenic mouse models have been used to show that a single gene can affect both serum HDL and BMD. Work completed to date has demonstrated that HDL can interact directly with both osteoblasts and osteoclasts, but no direct evidence links bone back to the regulation of HDL levels. Understanding the genetic relationship between BMD and HDL has huge implications for understanding the clinical relationship between CVD and osteoporosis and for the development of safe treatment options for both diseases.


Figures

Figure 1
Figure 1. Serum HDL and bone mineral density (BMD) in inbred strains of mice
Data for a variety of phenotypes in inbred strains of mice can be found in the Mouse Phenome Database [49]. A. Serum HDL data for female C57BL/6J, BTBR T+ Tf/J and 129S1/SvImJ mice was accessed from Project Yuan3. In this longitudinal study, mice were fed a standard low fat diet and serum HDL was measured at 6, 12 and 18 months of age using the Polydmedco/Denka Seiken methodology. B. Whole body areal BMD (aBMD) data from female C57BL/6J, BTBR T+ Tf/J and 129S1/SvImJ mice was accessed from Project Ackert1. In this cross-sectional study, mice were fed a standard low fat diet and aBMD was measured by dual X-ray absorptiometry (DXA) at 6, 12 and 20 months of age. The data in the Yuan3 and Ackert1 projects were collected by the Jackson Aging Centre and the mice were housed under similar environmental conditions. C. Serum HDL data for female C57BL/6J, BTBR T+ Tf/J and 129S1/SvImJ mice was accessed from Project Paigen2. In this study, mice were fed a standard rodent chow up to the age at which baseline HDL was measured (between 7 and 10 weeks of age). The mice were then placed on a high-fat, high-cholesterol atherogenic diet (pga.jax.org/athdiet.html) for 17 weeks and HDL was measured again in the same mice. D. A scatterplot plot comparing HDL versus BMD is presented using strain average data for the female mice from the 6 month old age cohort from the Yuan3 and Ackert1 datasets. Only those strains in which genetic loci for BMD and or HDL had been mapped are presented. E. A scatterplot plot comparing HDL versus BMD is presented for the same strains as in D, but using data from the 12 month old cohort. F. The correlation between the BMD and HDL data from the Yuan3 and Ackert1 datasets for the 6 and 12 months cohorts. Only strains used in genetic mapping studies were used in the correlations.
Figure 2
Figure 2. Quantitative trait loci (QTL) for HDL and BMD
The literature was searched for the known HDL and BMD QTL mapped in mice [–78]. In total 155 BMD QTL and 175 HDL QTL were identified. These QTL are plotted as follows: The central vertical black bar represents the chromosomal backbone. The HDL QTL are drawn on the left of the chromosome (white bars) and the BMD QTL are drawn on the right (grey bars). For each QTL, the peak location is indicated by a horizontal thick black tick mark and the vertical white or grey bars represent the 95% confidence intervals (CI). The CI are presented to scale using the literature listed CI when available. When no CI was listed, a conservative 20 cM interval was drawn to each side of the peak location, or to the top or bottom of the chromosome if that was closer. Black rectangles highlight locations of concordant peak locations when comparing the HDL and BMD QTL. For chromosomes for which there is little agreement among the crosses with regards to peak location for HDL (i.e. Chromosome 5), no attempt to identify concordant BMD-HDL QTL peaks was made.

References

    1. Elkeles A. Studies on osteoporosis. Br Med J. 1968;4:582. - PMC - PubMed
    1. Anderson JB, Barnett E, Nordin BE. The Relation between Osteoporosis and Aortic Calcification. Br J Radiol. 1964;37:910–2. - PubMed
    1. Heidenreich PA, Trogdon JG, Khavjou OA, Butler J, Dracup K, Ezekowitz MD, Finkelstein EA, Hong Y, Johnston SC, Khera A, Lloyd-Jones DM, Nelson SA, Nichol G, Orenstein D, Wilson PW, Woo YJ. Forecasting the Future of Cardiovascular Disease in the United States: A Policy Statement From the American Heart Association. Circulation. 2011 - PubMed
    1. Services USDoHaH . Bone Health and Osteoporosis: A Report of the Surgeon General. U.S. Department of Health and Human Services, Office of the Surgeon General; Rockville, MD: 2004. - PubMed
    1. Qi L, Shen H, Ordovas JM. Hearts and bones. Nutr Metab Cardiovasc Dis. 2003;13:165–74. - PubMed

Publication types