. 2011 Sep;60(9):2386-96.
doi: 10.2337/db10-1809. Epub 2011 Aug 1.

Protective role of cannabinoid receptor type 2 in a mouse model of diabetic nephropathy

Affiliations

Protective role of cannabinoid receptor type 2 in a mouse model of diabetic nephropathy

Federica Barutta et al. Diabetes. 2011 Sep.

Abstract

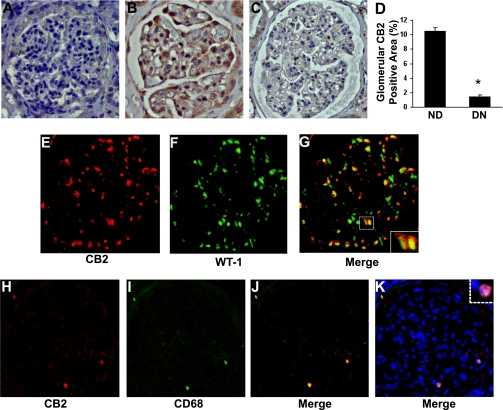
Objective: The cannabinoid receptor type 2 (CB2) has protective effects in chronic degenerative diseases. Our aim was to assess the potential relevance of the CB2 receptor in both human and experimental diabetic nephropathy (DN).

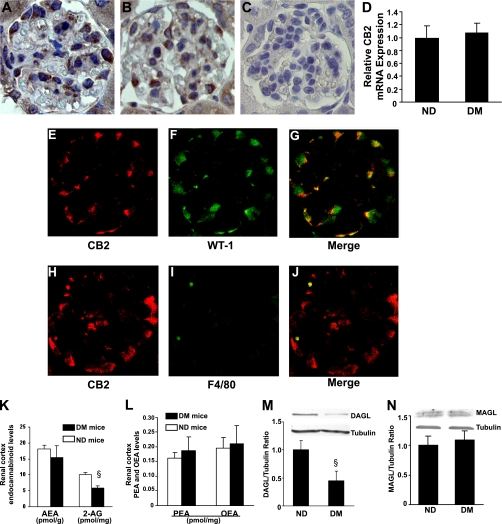
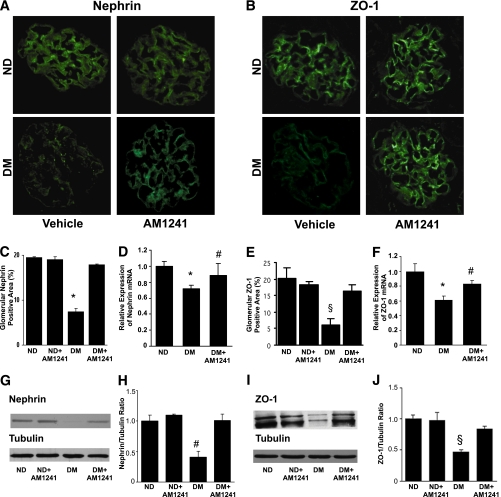
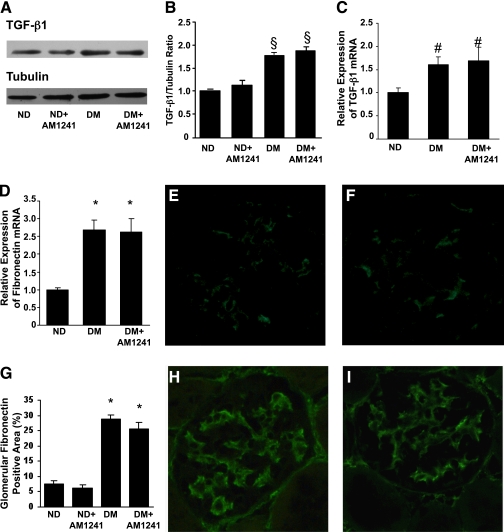
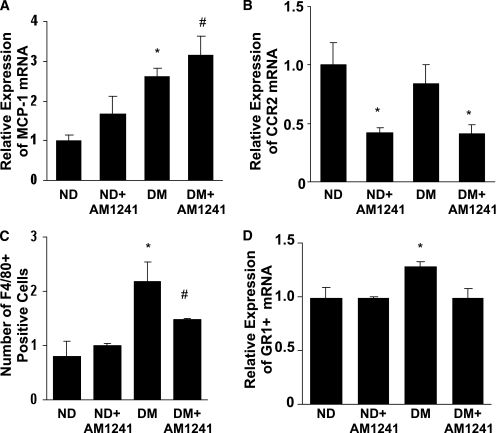
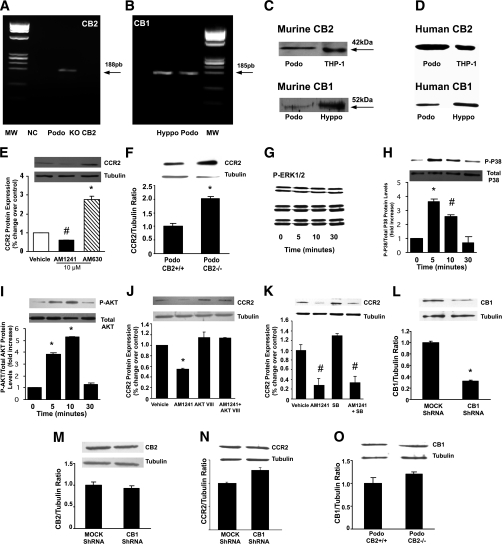
Research design and methods: CB2 expression was studied in kidney biopsies from patients with advanced DN, in early experimental diabetes, and in cultured podocytes. Levels of endocannabinoids and related enzymes were measured in the renal cortex from diabetic mice. To assess the functional role of CB2, streptozotocin-induced diabetic mice were treated for 14 weeks with AM1241, a selective CB2 agonist. In these animals, we studied albuminuria, renal function, expression of podocyte proteins (nephrin and zonula occludens-1), and markers of both fibrosis (fibronectin and transforming growth factor-β1) and inflammation (monocyte chemoattractant protein-1 [MCP-1], CC chemokine receptor 2 [CCR2], and monocyte markers). CB2 signaling was assessed in cultured podocytes.

Results: Podocytes express the CB2 receptor both in vitro and in vivo. CB2 was downregulated in kidney biopsies from patients with advanced DN, and renal levels of the CB2 ligand 2-arachidonoylglycerol were reduced in diabetic mice, suggesting impaired CB2 regulation. In experimental diabetes, AM1241 ameliorated albuminuria, podocyte protein downregulation, and glomerular monocyte infiltration, without affecting early markers of fibrosis. In addition, AM1241 reduced CCR2 expression in both renal cortex and cultured podocytes, suggesting that CB2 activation may interfere with the deleterious effects of MCP-1 signaling.

Conclusions: The CB2 receptor is expressed by podocytes, and in experimental diabetes, CB2 activation ameliorates both albuminuria and podocyte protein loss, suggesting a protective effect of signaling through CB2 in DN.


Figures

FIG. 1.
FIG. 1.
CB2 receptor expression in human DN. Glomerular CB2 protein expression was assessed by immunohistochemistry as detailed in the Supplementary Data. Specificity of the antibody was confirmed by the disappearance of the signal when the tissue was preabsorbed with a 10-fold excess of blocking peptide (A). B and C: CB2 staining in renal sections from nondiabetic subjects (ND) and diabetic patients with overt nephropathy (DN), respectively (original magnification ×200). The percent area of positive staining, quantified by a computer-aided image analysis system, is shown in the graph (D) (*P < 0.001 DN vs. ND). Double immunofluorescence for CB2 (E) and the podocyte marker WT-1 (F) was performed in control renal sections, whereas renal sections from diabetic patients were used for double staining of CB2 (H) and the macrophage marker CD68 (I). Positive staining colocalized as shown by merging (G and J). K: Nuclei were counterstained with DAPI. The dashed squares in G and K delimit areas shown at higher magnification. (A high-quality digital representation of this figure is available in the online issue.)
FIG. 2.
FIG. 2.
Endocannabinoid system in early experimental DN. CB2 protein expression was assessed in renal sections from nondiabetic (A) and diabetic mice (B) by immunohistochemistry. Renal sections from CB2 knockout mice served as negative control (C) (original magnification ×400). D: Glomerular CB2 mRNA levels were measured in both diabetic (DM) and nondiabetic (ND) mice by real-time PCR and corrected for the expression of the housekeeping gene HPRT. Double immunofluorescence for CB2 (E and H) and either the podocyte marker WT-1 (F) or the macrophage marker F4/80 (I) was performed on renal sections from diabetic mice. Colocalization was demonstrated by merging (G and J). Concentrations of endocannabinoids (AEA and 2-AG) (K) and endocannabinoid-related molecules (palmitoylethanolamide [PEA] and oleoylethanolamide [OEA]) (L) were measured in the renal cortex from both ND and DM mice by isotope dilution liquid chromatography mass spectrometry (§P < 0.01 DM vs. ND). Protein expression of DAGLα and MAGL was assessed in total renal cortex protein extracts by immunoblotting. Tubulin was used as internal control. Representative immunoblots and results of densitometry analyses are shown in M and NP < 0.05 DM vs. ND). (A high-quality digital representation of this figure is available in the online issue.)
FIG. 3.
FIG. 3.
Activation of the CB2 receptor by AM1241 prevented diabetes-induced downregulation of both nephrin and ZO-1. Control nondiabetic (ND) and diabetic (DM) mice were treated with either vehicle or the CB2 agonist AM1241 (3 mg/kg) via intraperitoneal injection for 14 weeks. Nephrin and ZO-1 mRNA and protein expression were assessed by immunofluorescence, immunoblotting, and real-time PCR. Representative immunofluorescence images of nephrin (A) and ZO-1 (B) are shown (original magnification ×400) and quantification of glomerular positive staining reported in the graphs in C and E (nephrin, *P < 0.001 DM vs. others; ZO-1, §P < 0.01 DM vs. others). Nephrin and ZO-1 mRNA levels were measured by real-time PCR on total RNA extracted from the renal cortex. Results were corrected for the expression of WT-1 as described in research design and methods and shown in the graphs in D and F (*P < 0.001 DM vs. ND; #P < 0.05 DM vs. DM+AM1241). G and I: Representative immunoblots of nephrin and ZO-1 protein expression in total protein extracts from the renal cortex. Tubulin was used as internal control. Results of densitometry analyses are reported in H and J (nephrin, #P < 0.05 DM vs. others; ZO-1, §P < 0.01 DM vs. others). (A high-quality digital representation of this figure is available in the online issue.)
FIG. 4.
FIG. 4.
CB2 activation did not affect overexpression of early markers of fibrosis in diabetic mice. Control nondiabetic mice (ND) and diabetic mice (DM) were treated with either vehicle or the CB2 agonist AM1241 (3 mg/kg) via intraperitoneal injection for 14 weeks. A: Representative immunoblot of TGF-β1 protein expression in total protein extracts from the renal cortex. Tubulin was used as internal control. Results of densitometry analysis are reported in BP < 0.01 DM and DM+AM1241 vs. ND). Fibronectin and TGF-β1 mRNA levels were measured by real-time PCR on total RNA extracted from the renal cortex. Results were corrected for the expression of HRPT and shown in the graphs in C and D (*P < 0.001, #P < 0.05 DM and DM+AM1241 vs. ND). Representative immunofluorescence images of fibronectin (E: ND, F: ND+AM1241, H: DM, I: DM+AM1241) are shown (original magnification ×400), and quantification of glomerular staining is reported in the graph in G (*P < 0.001 DM and DM+AM1241 vs. ND). (A high-quality digital representation of this figure is available in the online issue.)
FIG. 5.
FIG. 5.
Effect of CB2 activation on diabetes-induced markers of inflammation. Nondiabetic (ND) and diabetic (DM) mice treated with either vehicle or the CB2 agonist AM1241 (3 mg/kg/die i.p.) were studied 14 weeks after diabetes onset. MCP-1 (A), CCR2 (B), and GR1+ (D) mRNA levels were measured by real-time PCR on total RNA extracted from the renal cortex, and results were corrected for the expression of the housekeeping gene HRPT (A: *P < 0.01 DM vs. ND; #P < 0.05 DM+AM1241 vs. ND+AM124; B: *P < 0.05 DM+AM1241 and ND+AM1241 vs. ND and DM; D: *P < 0.01 DM vs. others). C: Glomerular monocyte accrual was assessed by counting the number of F4/80-positive cells within the glomeruli (*P < 0.01 DM vs. ND and ND+AM1241; #P < 0.05 DM+AM1241 vs. DM).
FIG. 6.
FIG. 6.
CB2 receptor expression and signaling in cultured podocytes. A and B: mRNA expression of both CB2 (A) and CB1 (B) was studied in murine-cultured podocytes by traditional real-time PCR, and representative 2% agarose gels stained with ethidium bromide are shown. MW, molecular weight marker; NC, negative control; Podo, murine podocytes; KO-CB2, renal tissue from CB2 knockout mice (negative control); Hyppo, hyppocampal tissue (positive control). C and D: CB2 and CB1 protein expression was assessed in protein extracts from murine- (Podo) (C) and human- (D) cultured podocytes by immunoblotting. Total protein extracts from a monocyte cell line (THP-1) and hyppocampal tissue (Hyppo) were used as positive control. E and F: CCR2 expression was assessed by immunoblotting on total protein extracts from murine podocytes (Podo) exposed to vehicle, AM1241 (10 μmol/L), or AM630 (10 μmol/L) for 24 h (E) and from CB2+/+ and CB2−/− murine podocytes (F). Tubulin was used as internal control. Representative immunoblots and results of densitometric analyses are shown (E: *P < 0.001 AM630 vs. vehicle, #P < 0.05 AM1241 vs. vehicle; F: *P < 0.05 podo CB2+/+ vs. podo CB2−/−). GI: Murine podocytes were exposed to AM1241 for 0, 5, 10, and 30 min, and then expression of both phosphorylated and total forms of ERK (G), p38 (H), and Akt (I) was assessed by immunoblotting (H: *P < 0.001 AM1241 at 5 min vs. control, #P < 0.01 AM1241 at 10 min vs. control; I: *P < 0.001 AM1241 at 5 and 10 min vs. control). J and K: CCR2 expression was studied in murine podocytes exposed to AM1241 for 24 h either in the presence or in the absence of the Akt inhibitor VIII (1 μmol/L) (J) or the p38 inhibitor SB202190 (SB) (K) by Western blotting (J: *P < 0.01 AM1241 vs. others; K: #P < 0.01 AM1241 and AM1241+SB vs. others). LN: Murine podocytes were stably transfected with either shRNA constructs designed to silence CB1 or mock shRNA. Expression of CB1 (L), CB2 (M), and CCR2 (N) was studied by immunoblotting (*P < 0.01 CB1 shRNA vs. mock shRNA). O: CB1 expression was studied in total protein extracts from wild-type and CB2 knockout podocytes (Podo) by immunoblotting. A representative immunoblot and results of densitometric analysis are shown.

References

    1. Molitch ME, DeFronzo RA, Franz MJ, et al. ; American Diabetes Association Nephropathy in diabetes. Diabetes Care 2004;27(Suppl. 1):S79–S83 - PubMed
    1. Cooper ME. Interaction of metabolic and haemodynamic factors in mediating experimental diabetic nephropathy. Diabetologia 2001;44:1957–1972 - PubMed
    1. Chow FY, Nikolic-Paterson DJ, Ozols E, Atkins RC, Rollin BJ, Tesch GH. Monocyte chemoattractant protein-1 promotes the development of diabetic renal injury in streptozotocin-treated mice. Kidney Int 2006;69:73–80 - PubMed
    1. Giunti S, Barutta F, Perin PC, Gruden G. Targeting the MCP-1/CCR2 system in diabetic kidney disease. Curr Vasc Pharmacol 2010;8:849–860 - PubMed
    1. Tarabra E, Giunti S, Barutta F, et al. Effect of the monocyte chemoattractant protein-1/CC chemokine receptor 2 system on nephrin expression in streptozotocin-treated mice and human cultured podocytes. Diabetes 2009;58:2109–2118 - PMC - PubMed

Publication types

MeSH terms