. 2011 Aug 16;124(7):796-805.
doi: 10.1161/CIRCULATIONAHA.111.031229. Epub 2011 Aug 1.

Critical role for stromal interaction molecule 1 in cardiac hypertrophy

Affiliations

Critical role for stromal interaction molecule 1 in cardiac hypertrophy

Jean-Sébastien Hulot et al. Circulation. .

Abstract

Background: Cardiomyocytes use Ca2+ not only in excitation-contraction coupling but also as a signaling molecule promoting, for example, cardiac hypertrophy. It is largely unclear how Ca2+ triggers signaling in cardiomyocytes in the presence of the rapid and large Ca2+ fluctuations that occur during excitation-contraction coupling. A potential route is store-operated Ca2+ entry, a drug-inducible mechanism for Ca2+ signaling that requires stromal interaction molecule 1 (STIM1). Store-operated Ca2+ entry can also be induced in cardiomyocytes, which prompted us to study STIM1-dependent Ca2+ entry with respect to cardiac hypertrophy in vitro and in vivo.

Methods and results: Consistent with earlier reports, we found drug-inducible store-operated Ca2+ entry in neonatal rat cardiomyocytes, which was dependent on STIM1. Although this STIM1-dependent, drug-inducible store-operated Ca2+ entry was only marginal in adult cardiomyocytes isolated from control hearts, it increased significantly in cardiomyocytes isolated from adult rats that had developed compensated cardiac hypertrophy after abdominal aortic banding. Moreover, we detected an inwardly rectifying current in hypertrophic cardiomyocytes that occurs under native conditions (i.e., in the absence of drug-induced store depletion) and is dependent on STIM1. By manipulating its expression, we found STIM1 to be both sufficient and necessary for cardiomyocyte hypertrophy in vitro and in the adult heart in vivo. Stim1 silencing by adeno-associated viruses of serotype 9-mediated gene transfer protected rats from pressure overload-induced cardiac hypertrophy.

Conclusion: By controlling a previously unrecognized sarcolemmal current, STIM1 promotes cardiac hypertrophy.


Conflict of interest statement

Disclosures

The authors declare no competing financial interest.

Figures

Figure 1
Figure 1. Role of STIM1 in store depletion-induced Ca2+ entry in neonatal cardiomyocytes
(A) Fluorescence analysis of Ca2+ entry in neonatal rat cardiomyocytes (NRCM). Left, representative recordings of the Fura-2 emission ratio (F340/380) in cardiomyocytes after SR Ca2+ depletion (by Ca2+ removal and thapsigargin addition) and subsequent switch to Ca2+-containing buffer. 72 h before measurement, cells were infected with adenovirus encoding STIM1 (Ad-Stim1), a short hairpin to reduce STIM1 (Ad-shStim1) and controls expressing β-galactosidase (Ad-LacZ) and scrambled shRNA (Ad-shScr). (B) Ca2+ entry in cardiomyocytes isolated from Stim1−/− mice. Upon extracellular addition of Ca2+ (2 mM), store-operated Ca2+ entry occurred in control (n=53) cardiomyocytes, but not in Stim1−/− cardiomyocytes (n=11). Data are mean ± s.e.m. and * P < 0.05, ** P < 0.01, *** P < 0.005 in this and other figures. (C) Microscopic detection (TIRF) of endogenous STIM1 in isolated NRCM. Immunofluorescent staining for STIM1 (red) and α-actinin (green) before and after Ca2+ depletion of the SR. Scale bar represents 5 μm.
Figure 2
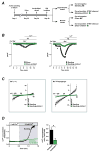
Figure 2. STIM1-dependent cation currents in adult cardiomyocytes
(A)Schematic timescale and experimental strategy to analyze SOC currents in adult rat cardiomyocytes (ARCM). Cells were isolated 28 days after abdominal aortic constriction or sham treatment. The Ad-shStim1-dsRed vector was administered on day 24 after surgery. Isolated ARCM were assigned to the shStim or the control group (=non-infected) based on dsRed fluorescence, thus allowing to compare the effects of reduced versus normal Stim1 expression in a collective of cells from the same animal. (B) Whole cell patch clamp recordings in ARCM before and after SR Ca2+ store depletion by thapsigargin (TG). Left, Recordings of Ba2+ current (ISOC) in the presence or absence of thapsigargin-induced SR store depletion in cardiomyocytes from sham-treated rats. Cells in which STIM1 expression had been reduced by Ad-shStim1-dsRed (green symbols) are shown next to tracings of non-silenced cardiomyocytes (black symbols). Right, Same recordings conducted on ARCM isolated after pressure overload. Recordings were performed at −80 mV. Analyses are from 3 animals/group with >10 cells/animal. (C) Isoc current-to-voltage relation after Ba2+ (asterisk) and Ba2+/thapsigargin perfusion as indicated in (A) in non-infected (black) or Ad-shStim1-dsRed infected (green) ARCM from pressure-overloaded hearts. Tracings display the average of 12 cells (banding) and 6 cells (banding shStim1). (D) Fluorescence analysis of Ca2+ entry in hypertrophic ARCM. Cardiomyocytes were isolated from hypertrophic hearts as in (A), and loaded with the Ca2+-sensor Indo-1. Store-operated entry of Ca2+ was induced as described in Figure 1A, and was detected as increased Indo-1 emission ratio (F405/480). Left, representative tracings recorded from hypertrophic cardiomyocytes with or without silencing of Stim1. Right, quantitation from 3 independent experiments, with 3 animals/group and >10 cells analyzed/animal.
Figure 3
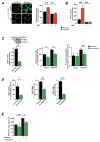
Figure 3. Role of STIM1 in cardiomyocyte growth and signaling
(A) Effects of STIM1 overexpression on the growth of neonatal rat cardiomyocytes. Left, immunofluorescence analysis of NRCM infected with adenoviral vectors (MOI 10) encoding β-galactosidase (Ad-LacZ) or STIM1 (Ad-Stim1) and treated with the SOCE inhibitor SKF96365 or control (DMSO). Immunofluorescence analysis was carried out 48h after stimulation, using an antibody against α-actinin (green). Nuclei were stained with DAPI. Scale bar represents 5 μm. Right, quantitation of cardiomyocyte area. (B) Determination of NFAT activity by luciferase reporter assay in NRCM that have been treated as in (A). (C) Effects of Stim1 silencing on cardiomyocyte hypertrophy. Left, Western blot detecting STIM1 in cardiomyocytes 72h after infection with an adenoviral silencing vector (Ad-shStim1) or a control (Ad-shScr), and quantitative analysis of the results. Center, surface area determination of the cardiomyocytes. Right, 3H-leucine incorporation during 48 h of stimulation with phenylephrine (50 μM), three days after infection. (D) Effects of STIM1-silencing on phenylephrine-induced NFAT activation and expression of atrial natriuretic factor (ANF) and modulatory calcineurin-interacting protein 1 (MCIP1). (E) Membrane capacitance of cardiomyocytes as a measure of cell size. ARCM infected with Ad-shStim1 were isolated as depicted in Figure 2. n ≥6 for all groups. Data are from ≥3 independent experiments with ≥3 replicates each, except that two independent experiments were performed for 3H-leucine detection in (C), ANF and MCIP mRNA determination in (D). >500 cells were analyzed in each independent experiment in (A) and (C).
Figure 4
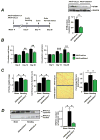
Figure 4. Silencing of STIM in a model of pressure-induced cardiac hypertrophy in vivo
(A) Left, experimental strategy for the analysis of STIM1 silencing in living rats. Right, immunoblot analysis of STIM1 and GAPDH in lysates from AAV9-shLuc- and AAV9-shStim1-treated hearts. For quantitation, STIM1 data were normalized to the GAPDH signal in each lane. n=8 per group. (B) Serial echocardiographic measurements of left ventricular anterior and posterior wall dimensions in AAV9-shStim1 or AAV9-shLuc treated rats. n=8/group. (C) Left, postmortem determination of the ratio of left ventricle to body weight (LV/BW) in AAV9-shStim1 or AAV9-shLuc treated rats (n=8/group). Middle, average cardiomyocyte diameter in each group (> 20 cells/animal from 4 animals/group). Right, sirius red staining for interstitial fibrosis in sections of left ventricular tissue, and quantitative analysis from 5 animals per group. (D) Detection and quantitation of NFAT in subcellular fractions by immunoblot analysis.

Comment in

References

    1. Bers DM. Calcium cycling and signaling in cardiac myocytes. Annu Rev Physiol. 2008;70:23–49. - PubMed
    1. Guatimosim S, Dilly K, Santana LF, Saleet Jafri M, Sobie EA, Lederer WJ. Local Ca(2+) signaling and EC coupling in heart: Ca(2+) sparks and the regulation of the [Ca(2+)](i) transient. J Mol Cell Cardiol. 2002;34:941–950. - PubMed
    1. Backs J, Olson EN. Control of cardiac growth by histone acetylation/deacetylation. Circ Res. 2006;98:15–24. - PubMed
    1. Heineke J, Molkentin JD. Regulation of cardiac hypertrophy by intracellular signalling pathways. Nat Rev Mol Cell Biol. 2006;7:589–600. - PubMed
    1. Molkentin JD. Calcineurin and beyond: cardiac hypertrophic signaling. Circ Res. 2000;87:731–738. - PubMed

Publication types

MeSH terms