. 2011 Aug 2:7:518.
doi: 10.1038/msb.2011.52.

Metabolic network reconstruction of Chlamydomonas offers insight into light-driven algal metabolism

Affiliations

Metabolic network reconstruction of Chlamydomonas offers insight into light-driven algal metabolism

Roger L Chang et al. Mol Syst Biol. .

Abstract

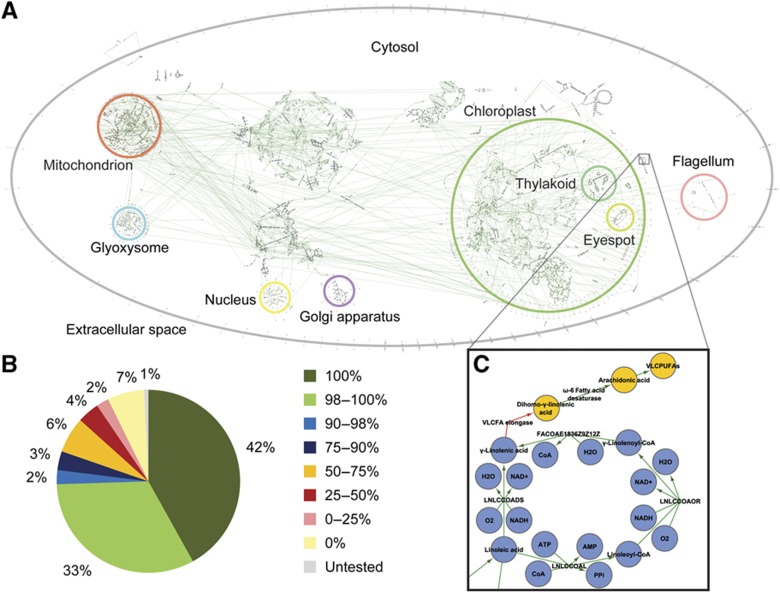
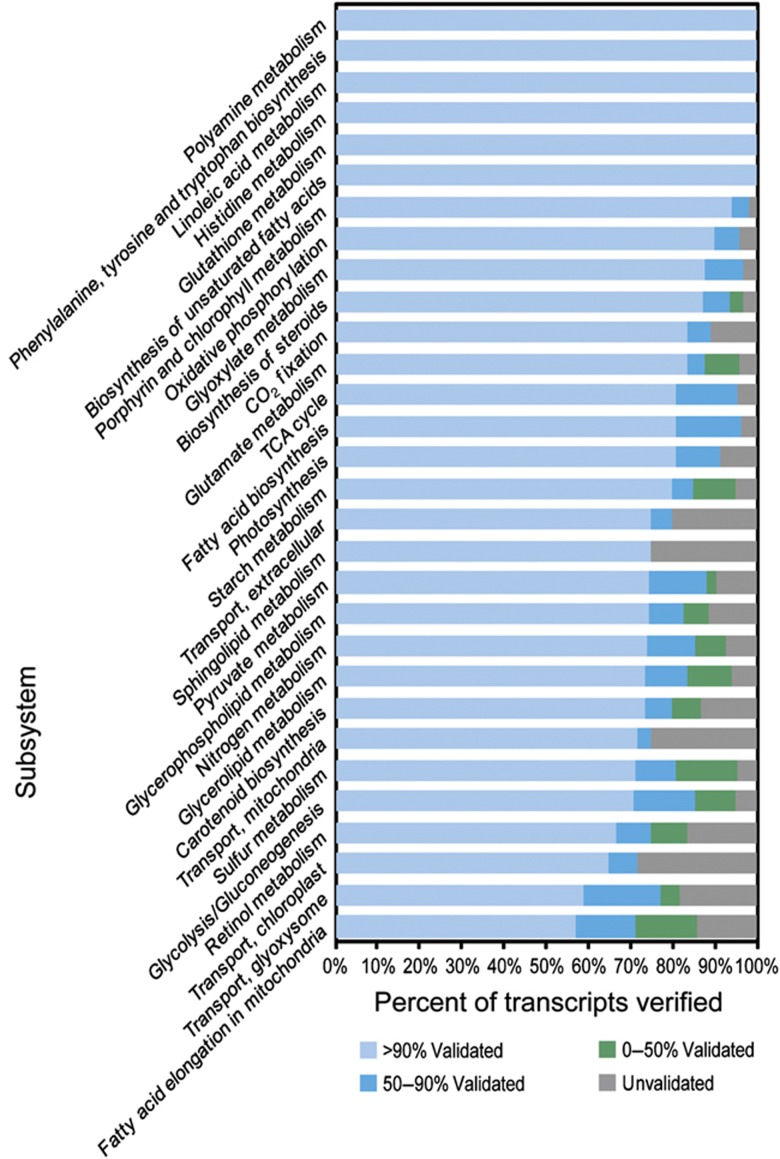
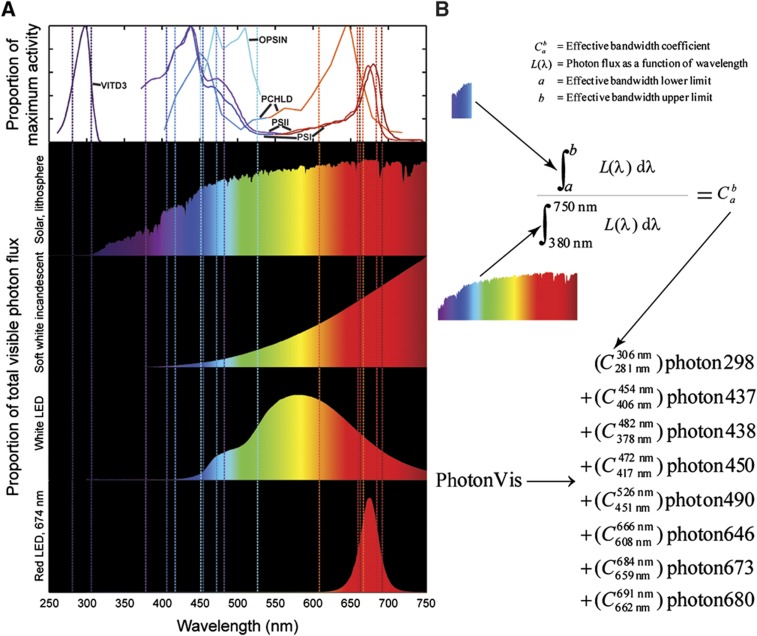
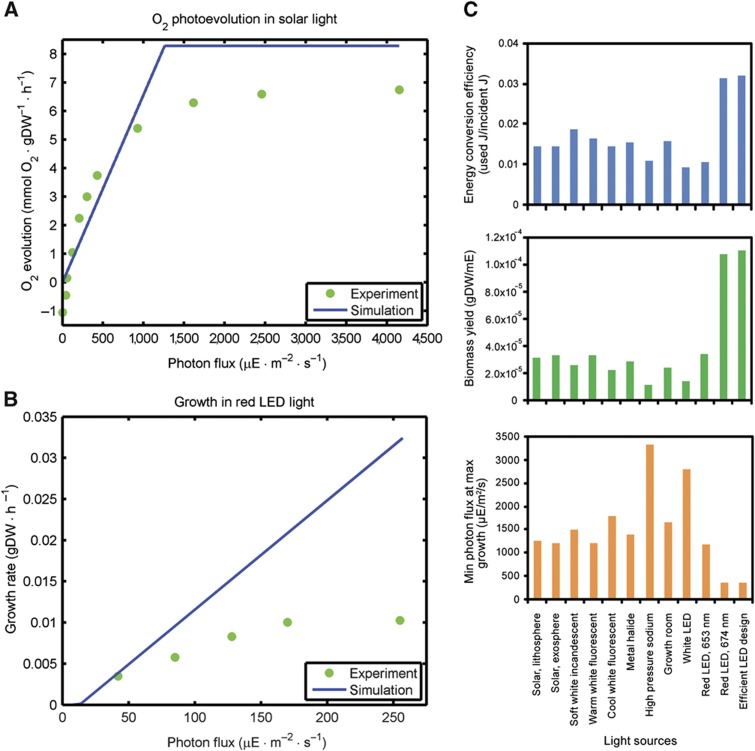
Metabolic network reconstruction encompasses existing knowledge about an organism's metabolism and genome annotation, providing a platform for omics data analysis and phenotype prediction. The model alga Chlamydomonas reinhardtii is employed to study diverse biological processes from photosynthesis to phototaxis. Recent heightened interest in this species results from an international movement to develop algal biofuels. Integrating biological and optical data, we reconstructed a genome-scale metabolic network for this alga and devised a novel light-modeling approach that enables quantitative growth prediction for a given light source, resolving wavelength and photon flux. We experimentally verified transcripts accounted for in the network and physiologically validated model function through simulation and generation of new experimental growth data, providing high confidence in network contents and predictive applications. The network offers insight into algal metabolism and potential for genetic engineering and efficient light source design, a pioneering resource for studying light-driven metabolism and quantitative systems biology.


Figures

Figure 1
Figure 1
Contents of the iRC1080 metabolic network reconstruction. (A) Compartmentalized network diagram. The full genome-scale metabolic network is depicted, denoting compartments. A high-resolution diagram without compartment labels is also available (Supplementary Figure S1). (B) Global transcript verification status. The graph shows the distribution of transcripts accounted for in the network categorized by their verification status. Color codes correspond to the noted percentage of transcript sequence verified experimentally. For example, 42% of transcripts in the network were verified experimentally by 100% sequence coverage. (C) Latent VLCPUFA pathway diagram. Blue nodes represent metabolites included in iRC1080, and orange nodes represent metabolites not included in iRC1080, hypothesized to be absent in C. reinhardtii. Green edges represent enzyme activities accounted for in our functional annotation, and the red edge represents the VLCFA elongase missing from our annotation and hypothesized to have been lost in C. reinhardtii's evolution. This pathway diagram also demonstrates the detail of the high-resolution network diagram (Supplementary Figure S1).
Figure 2
Figure 2
Experimental transcript verification by subsystem. The graph summarizes transcript verification status (see Materials and methods and Supplementary information for details) for 30 of the 76 gene-associated subsystems of iRC1080. Identical analysis for the full complement of 76 subsystems is also available (Supplementary Figure S2). The x axis corresponds to the percentage of subsystem-associated transcripts that were experimentally verified to the extent noted by the color code.
Figure 3
Figure 3
Analysis of light spectra. (A) Activity and irradiance spectra. The top graph displays activity spectra for photon-utilizing reactions included in iRC1080. The abbreviated reactions are defined as follows: VITD3, vitamin D3 synthesis; OPSIN, rhodopsin photoisomerase; PCHLD, both protochlorophyllide photoreductase and divinylprotochlorophyllide photoreductase; PSI, photosystem I; PSII, photosystem II. The y axis for the activity spectra is the fraction of maximum-measured activity with respect to each noted reaction. Four of the eleven sample irradiance spectra (Supplementary Figure S3) are depicted with y axes set as the percentage of total visible photon flux at each wavelength (x axis). Effective spectral bandwidths are denoted by vertical dashed lines color coded to match the activity spectra for each reaction. (B) Prism reaction derivation. The photon flux from wavelengths a to b is normalized by the total visible photon flux from 380 to 750 nm to yield the effective spectral bandwidth coefficient C. The coefficients for each range are compiled into a single prism reaction for a given light source, representing the composition of emitted light as defined by photon-utilizing metabolic reactions. Equation variables are defined at top.
Figure 4
Figure 4
Photosynthetic model simulation results. (A) O2 photoevolution under solar light. Simulated (blue line) and experimentally measured (green dots) O2 evolution are compared. (B) Photosynthetic growth under red LED light. Simulations were performed using the 653-nm prism reaction, and experimentally grown culture was exposed to 660 nm LED light. Simulated (blue line) and experimentally measured (green dots) growth are compared. (C) Efficiency of light utilization. The minimum photon flux required for maximum-simulated growth (bottom), biomass yield (middle), and energy conversion efficiency (top) are presented for 11 light sources derived from measured spectra and for the designed growth-efficient LED.
Figure 5
Figure 5
Distributions of randomly sampled distances from experimental measurements. (A) O2 photoevolution under solar light. (B) Photosynthetic growth under red LED light. (C) Photosynthetic growth under white incandescent light. All three distance distributions result from 10 000 unbiased sampling results in which random prism reactions were generated with the same total metabolically active photon flux as the given light source. Each distribution is depicted in 25 equal-sized bins. The red dot in each plot is placed over the bin in which the distance of the reported simulation result for the given light source falls; the vertical placement of each red dot indicates the number of randomly sampled distances within the same bin that are less than that of the reported result.

Similar articles

Cited by

References

    1. Akkerman I, Janssen M, Rocha J, Wijffels RH (2002) Photobiological hydrogen production: photochemical efficiency and bioreactor design. Int J Hydrogen Energy 27: 1195–1208
    1. Baroli I, Do AD, Yamane T, Niyogi KK (2003) Zeaxanthin accumulation in the absence of a functional xanthophyll cycle protects Chlamydomonas reinhardtii from photooxidative stress. Plant Cell 15: 992–1008 - PMC - PubMed
    1. Barta DJ, Tibbitts TW, Bula RJ, Morrow RC (1992) Evaluation of light emitting diode characteristics for a space-based plant irradiation source. Adv Space Res 12: 141–149 - PubMed
    1. Becker SA, Feist AM, Mo ML, Hannum G, Palsson BO, Herrgard MJ (2007) Quantitative prediction of cellular metabolism with constraint-based models: the COBRA Toolbox. Nat Protoc 2: 727–738 - PubMed
    1. Berg J, Tymoczko J, Stryer L (2007) Biochemistry. New York, USA: W.H. Freeman

Publication types

MeSH terms